Shiba Inu price rallies 15%, but the dog smells like a smart money trap
- Shiba Inu Price surges 15% during the London session.
- The Volume Profile Indicator shows an influx of transactions pouring in on intra-hour time frames.
- A daily close above $0.00001700 would add more confidence that the uptrend spike is a genuine start of the next rally.

Shiba Inu price makes an impressive recovery on Thursday, August 25. Still, investors should apply caution to avoid getting lured into a trap.
Shiba Inu price shows applaudable efforts.
Shiba Inu price has shown a significant increase in volatility since the start of the London session on Thursday, August 25. Since the opening bell, the notorious meme coin has rallied by 15%. The bullish surge is certainly eye candy for sidelined investors as market sentiment shows considerable optimism amidst Biden's Debt-Relief program.
Shiba Inu currently auctions at $0.00001471 as an influx of volume pours in on smaller time frames. The self-proclaimed Doge-killer may continue to provide profitable opportunities to day traders. Still, long-term investors should be wary of getting lured into buying the SHIB price before the daily settlement. A daily close above $0.00001700 would add more confidence that the uptrend spike is a genuine start of the next rally.
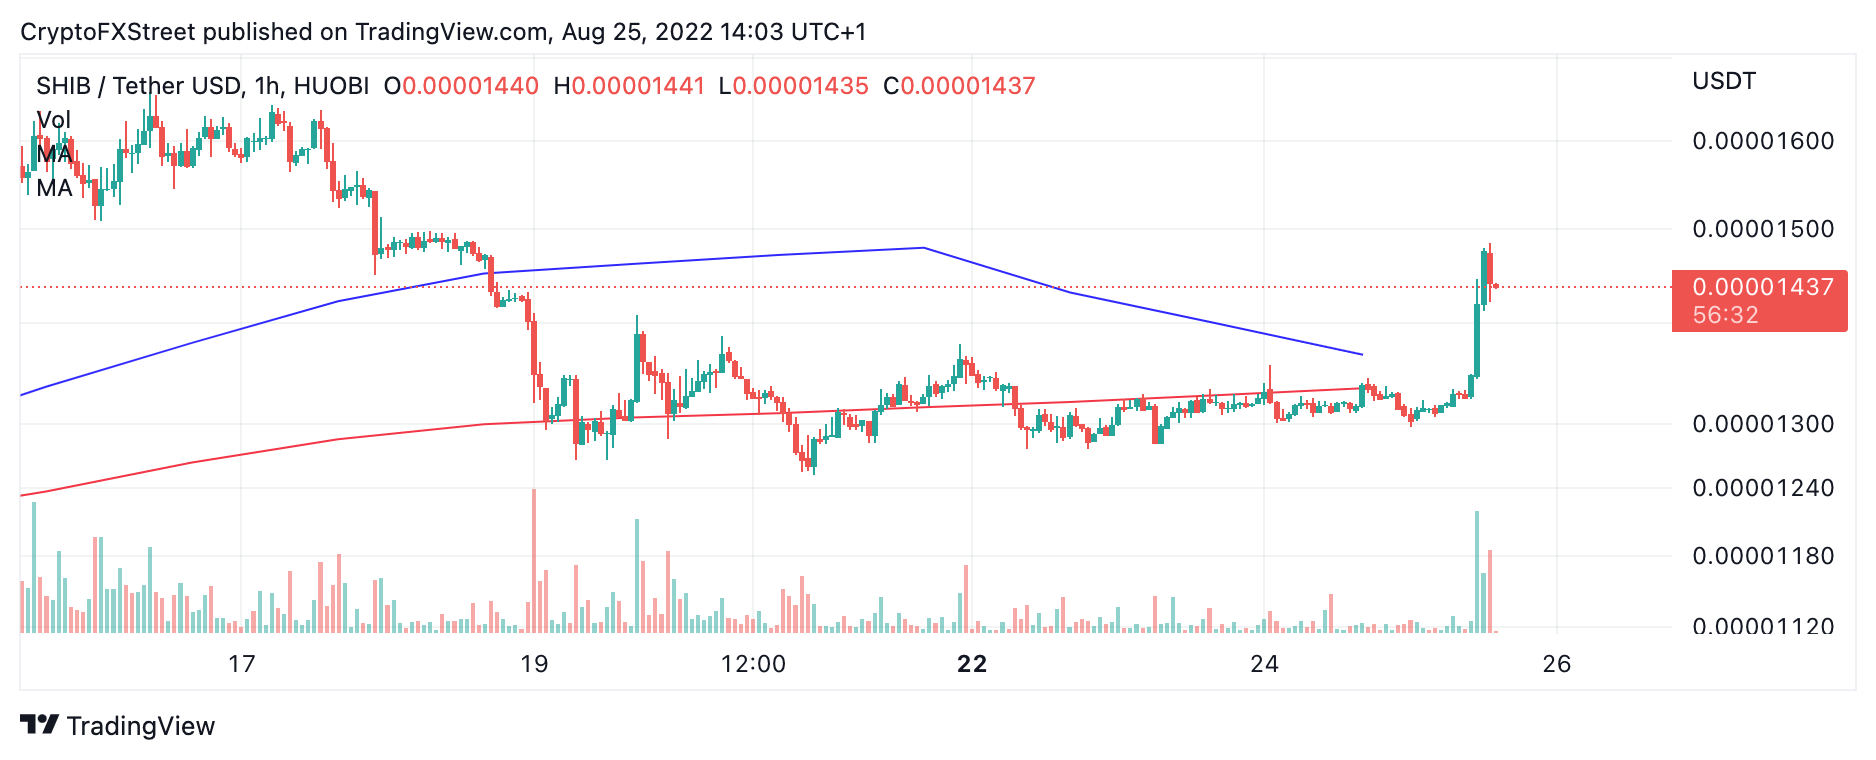
SHIB/USDT 1-Hour Chart
Santiment's on-chain analysis tools confound the call for caution. Specifically, the total amount of SHIB tokens on all exchanges remains unhinged throughout the summer. At currently 144 trillion tokens, the SHIB price remains highly susceptible to whale influence as prices witnessed a 90% decline from all-time highs while the SHIB price was at 148 trillion tokens on exchanges. The 10% deduction of tokens from exchanges may not be enough to prevent a Smart Money heist of the notorious meme token.

Santiment's Price, Volume and Supply on Echanges Indicator
In the following video, our analysts deep dive into the price action of Shiba Inu, analyzing key levels of interest in the market. -FXStreet Team
Author

Tony M.
FXStreet Contributor
Tony Montpeirous began investing in cryptocurrencies in 2017. His trading style incorporates Elliot Wave, Auction Market Theory, Fibonacci and price action as the cornerstone of his technical analysis.