- Talks of burned tokens and their impact on the Shiba Inu price persist throughout social media and media outlets.
- SHIB price shows a massive uptick in bearish volume accompanied by severe bearish divergence.
- Invalidation of the bearish thesis is a breach and close above $0.00001700.
Shiba Inu price market sentiment remains optimistic despite the penny-from-Eiffel style decline.
Shiba Inu price de-correlates
Shiba Inu price shows extremely bearish technicals, confounding that a sweep of the lows event could be underway. The technicals suggested that an immediate liquidation could occur after a five-wave impulse into the bullish targets occurred.
On August 15, both bullish targets were breached as the Shiba Inu price saw a 35% hike in just one day. As a result of the buyer’s surge, the Relative Strength Index (RSI) measured the Shiba Inu price as more overbought than when the notorious dog coin price traded nearly 150% higher at $0.00003261 back in February of 2022. Accompanied with the RSI bearish divergence was an influx of bearish volume near the top of the price hike and a classical bearish ramping pattern.
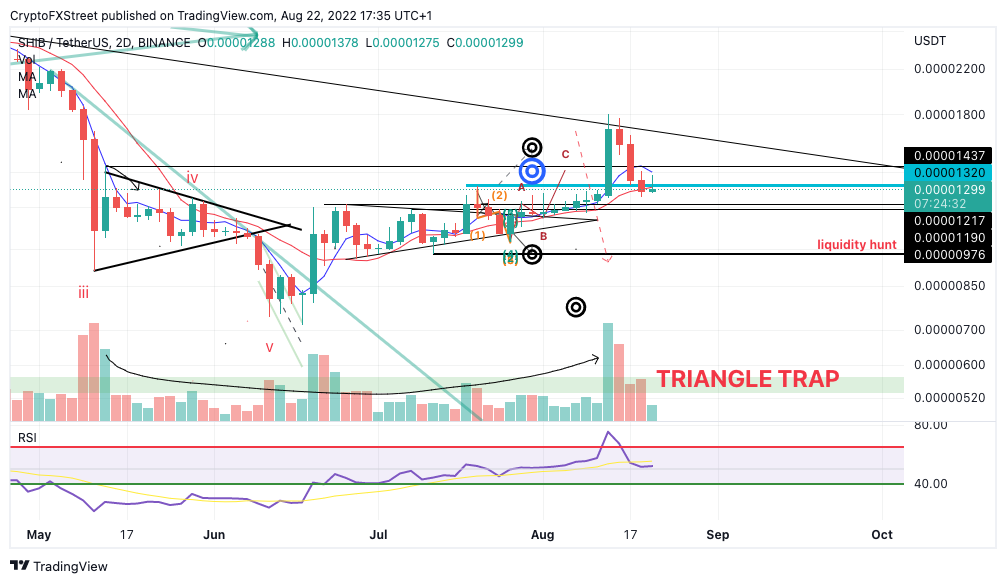
SHIB/USDT 2-Day Chart
Shiba Inu price currently trades at $0.00001304. Despite the extreme bearish signals, an influx of headline news persists in the media about Shiba Inu tokens being burned from the total supply. According to the Economic Times, 400 trillion tokens were recently burned in the summer of 2022.
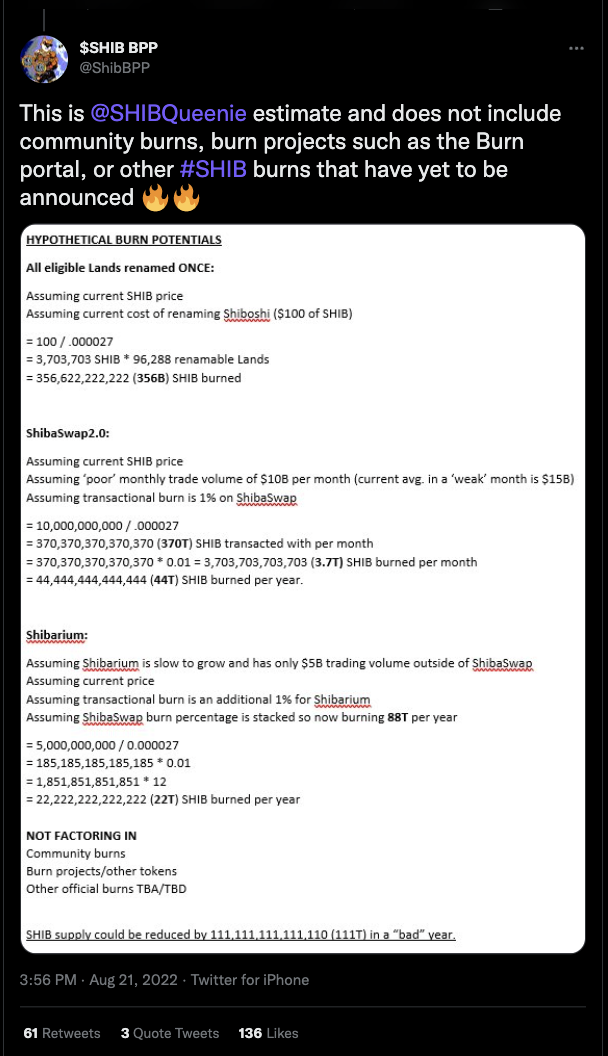
Twitter accounts have contributed to the discussion with theoretical models of what the impact burning SHIB tokens could have on the Shiba Inu price and overall ecosystem. According to a popular Twitter account and SHIB advocate @SHIBBPP, 111 trillion tokens could be burned within months.
Despite the optimistic market sentiment, the Shiba Inu price has not correlated well with the burned-token theory. From a technical standpoint, the SHIB price has struggled to make persistent gains, and the recent 35% upswing may have been too steep for the bulls to sustain. What was once a profit-taking consolidation near the $0.00001500 levels has morphed into a “penny-from-Eiffel” style decline as the SHIB price is currently down 27% since the new monthly high at $.00001800 high was established.
The recent pump and dump confound the previous technical outlooks forecasting a further 25% decline. Bearish targets of interest are near $0.00000970 liquidity levels in the short term.
Invalidation of the bearish thesis is a breach and close above $0.00001700. If the bulls can breach this level, they may be able to prompt a bullish scenario targeting $0.00001978, resulting in a 52% increase from the current Shiba Inu price.
In the following video, our analysts deep dive into the price action of Shiba Inu, analyzing key levels of interest in the market. -FXStreet Team
Information on these pages contains forward-looking statements that involve risks and uncertainties. Markets and instruments profiled on this page are for informational purposes only and should not in any way come across as a recommendation to buy or sell in these assets. You should do your own thorough research before making any investment decisions. FXStreet does not in any way guarantee that this information is free from mistakes, errors, or material misstatements. It also does not guarantee that this information is of a timely nature. Investing in Open Markets involves a great deal of risk, including the loss of all or a portion of your investment, as well as emotional distress. All risks, losses and costs associated with investing, including total loss of principal, are your responsibility. The views and opinions expressed in this article are those of the authors and do not necessarily reflect the official policy or position of FXStreet nor its advertisers. The author will not be held responsible for information that is found at the end of links posted on this page.
If not otherwise explicitly mentioned in the body of the article, at the time of writing, the author has no position in any stock mentioned in this article and no business relationship with any company mentioned. The author has not received compensation for writing this article, other than from FXStreet.
FXStreet and the author do not provide personalized recommendations. The author makes no representations as to the accuracy, completeness, or suitability of this information. FXStreet and the author will not be liable for any errors, omissions or any losses, injuries or damages arising from this information and its display or use. Errors and omissions excepted.
The author and FXStreet are not registered investment advisors and nothing in this article is intended to be investment advice.
Recommended Content
Editors’ Picks
Ripple's move above this key level could trigger nearly 50% rally for XRP
Ripple has overcome a critical resistance level and flipped into a support floor on the weekly time frame. This development happened while XRP tightly consolidated for roughly 250 days. Investors can expect XRP to kickstart a massive rally.
Optimism price outlook with nearly $90 million worth of OP tokens flooding markets on Friday
Optimism volatility has shrunk in the ours leading to the network’s cliff unlock. It joins the likes of dYdX and Sui, which have similar events on their calendars. As token unlocks are often considered bearish catalysts, investors should brace for a reaction after the event.
Top 3 Price Prediction Bitcoin, Ethereum, Ripple: Retail watches from the sidelines with a bias for shorts
Bitcoin could clear $73,777 peak as BTC bulls resurface. Ethereum might fall 10% before next leg up as ETH RSI teases with sell signal. XRP could lose $0.6000 threshold as Ripple bulls fail to show up.
Jito price could hit $6 as JTO coils up inside this bullish pattern
Jito price action shows a potential cup and handle formation. Based on theoretical measurement rules, a successful breakout could yield a 56% rally to $6.0. A breakdown of the $3.86 support level would create a lower low for JTO and invalidate the bullish thesis.
Bitcoin: BTC may have recovered, but is it out of the woods?
Bitcoin’s (BTC) upward momentum has shown a significant decline for the past two weeks or so. This development led to a bearish signal on the weekly and an uncertain outlook on the monthly.