Shiba Inu Price Prediction: SHIB bulls poised for 44% upswing
- Shiba Inu price is projecting a positive outlook as the governing technical chart pattern projects a 44% climb.
- SHIB must slice above the neckline of the prevailing chart pattern at $0.00003628 in order for the bullish chart pattern to be validated.
- If Shiba Inu falls below $0.00002826, the optimistic outlook could be invalidated.
Shiba Inu price has formed a bullish chart pattern, suggesting an optimistic outlook for the canine-themed token. If SHIB slices above $0.00003628, the coin could be headed for a 44% ascent, a target given by the prevailing chart pattern.
Shiba Inu bulls eye $0.00005336 next
Shiba Inu price has formed an inverse head-and-shoulders pattern on the 12-hour chart, projecting a 44% upswing toward $0.00005336. Investors should note that the bullish target would only be put on the radar if SHIB slices above the neckline of the prevailing chart pattern at $0.00003628.
The first line of resistance will emerge at the 200 twelve-hour Simple Moving Average (SMA) at $0.00003384, then at the 78.6% Fibonacci retracement level at $0.00003468. If buying pressure continues to increase, SHIB may tag the neckline of the governing technical pattern at $0.00003628.
Only if Shiba Inu price slices above the aforementioned neckline of the prevailing chart pattern could see SHIB target the optimistic forecast at $0.00005336.
Additional headwinds may emerge at the December 27 high at $0.00003949, then at the 127.2% Fibonacci extension level at $0.00004560. If Shiba Inu price breaks above the November 20 high at $0.00005000, SHIB could tag the bullish target at $0.00005336, coinciding with the 161.8% Fibonacci extension level.
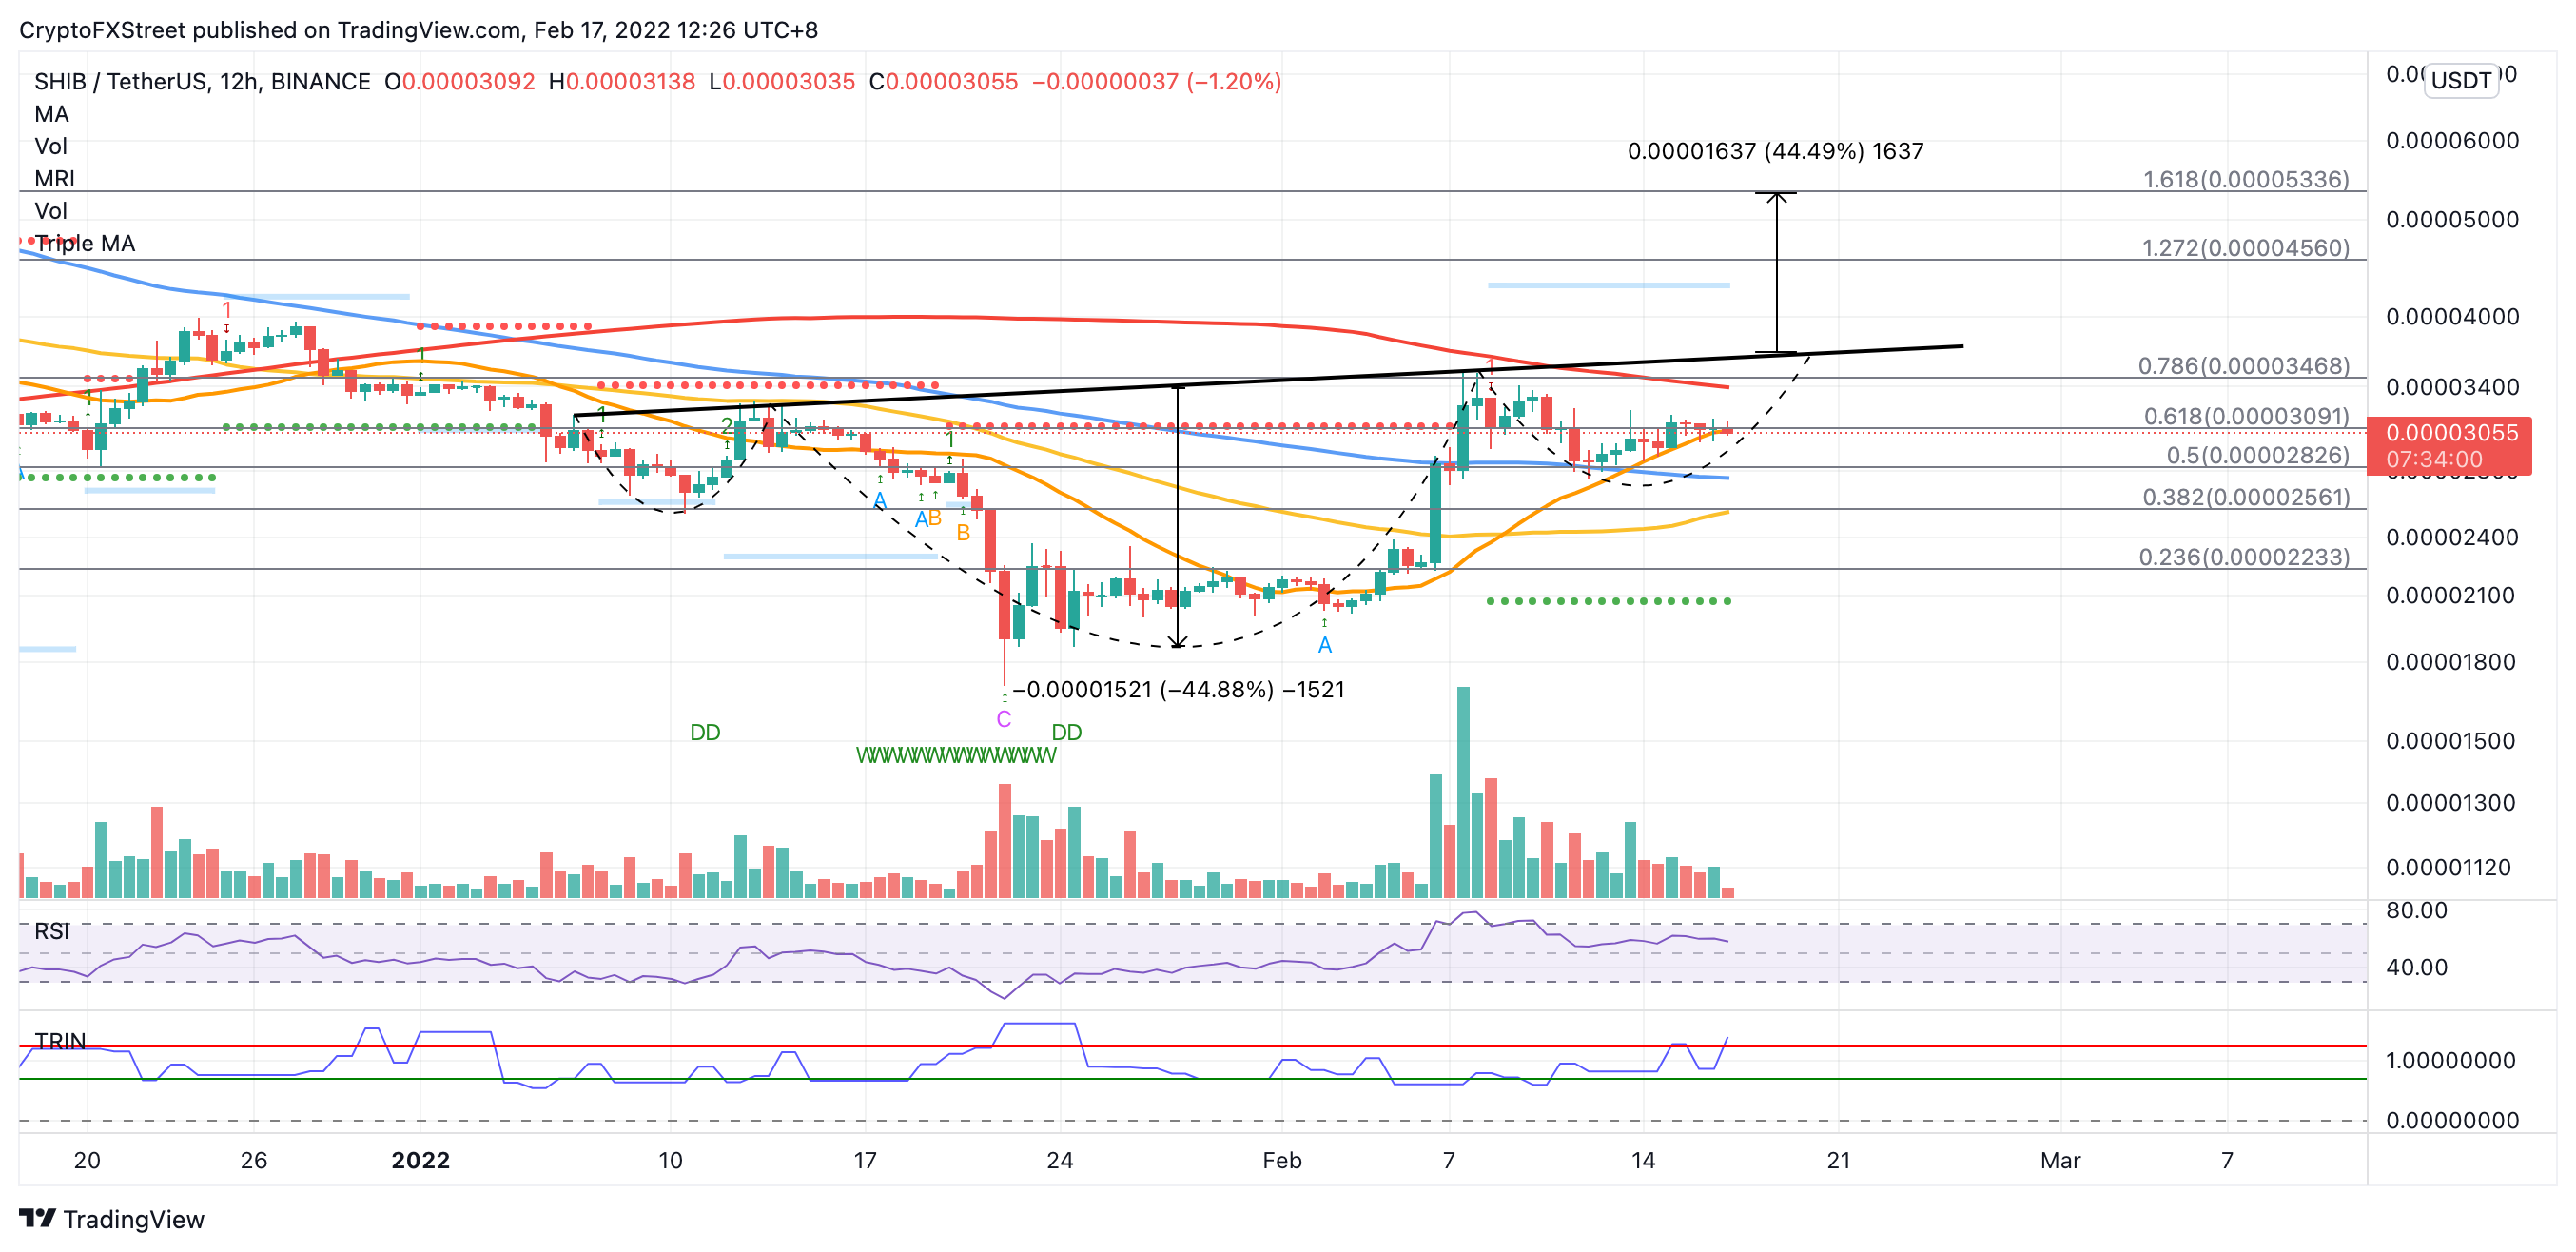
SHIB/USDT 12-hour chart
If selling pressure increases, Shiba Inu price will fall toward the immediate line of defense at the 61.8% Fibonacci retracement level at $0.00003091. SHIB will discover another foothold at the 50% retracement level at $0.00002826, coinciding with the 100 twelve-hour SMA. However, dropping below this level will invalidate the bullish outlook.
If a spike in sell orders occurs, Shiba Inu price could fall toward the 50 twelve-hour SMA at $0.00002561, which intersects with the 38.2% Fibonacci retracement level. SHIB could drop toward the 23.6% Fibonacci retracement level at $0.00002233 next if bearish sentiment increases.
Author

Sarah Tran
Independent Analyst
Sarah has closely followed the growth of blockchain technology and its adoption since 2016.


