Shiba Inu price could crash 15% as SHIB approaches a weakened support
- Shiba Inu price retraces closer to retest the four-hour demand zone, extending from $0.0000274 to $0.0000289.
- A breakdown of this barrier is likely to trigger a steep correction to the $0.0000235 support level.
- A swing high above $0.0000342 will invalidate the bearish thesis for SHIB.

Shiba Inu price sliced through a crucial support area as it rallied exponentially in February. This run-up created a platform that helped facilitate the extension of the rally. SHIB is currently retesting this barrier again, hinting at a breakdown.
Shiba Inu price needs to tiptoe
Shiba Inu price rallied 57% between February 6 and February 8, setting up a swing high at $0.0000351. This run-up weakened and began consolidation by erecting lower highs as it edges closer to the four-hour demand zone, ranging from $0.0000274 to $0.0000289.
This barrier is crucial in determining the directional bias of the meme coin. A four-hour candlestick close below $0.0000274 will invalidate the footing by creating a lower low. This development is the key to triggering a 15% correction to the $0.0000235 support level.
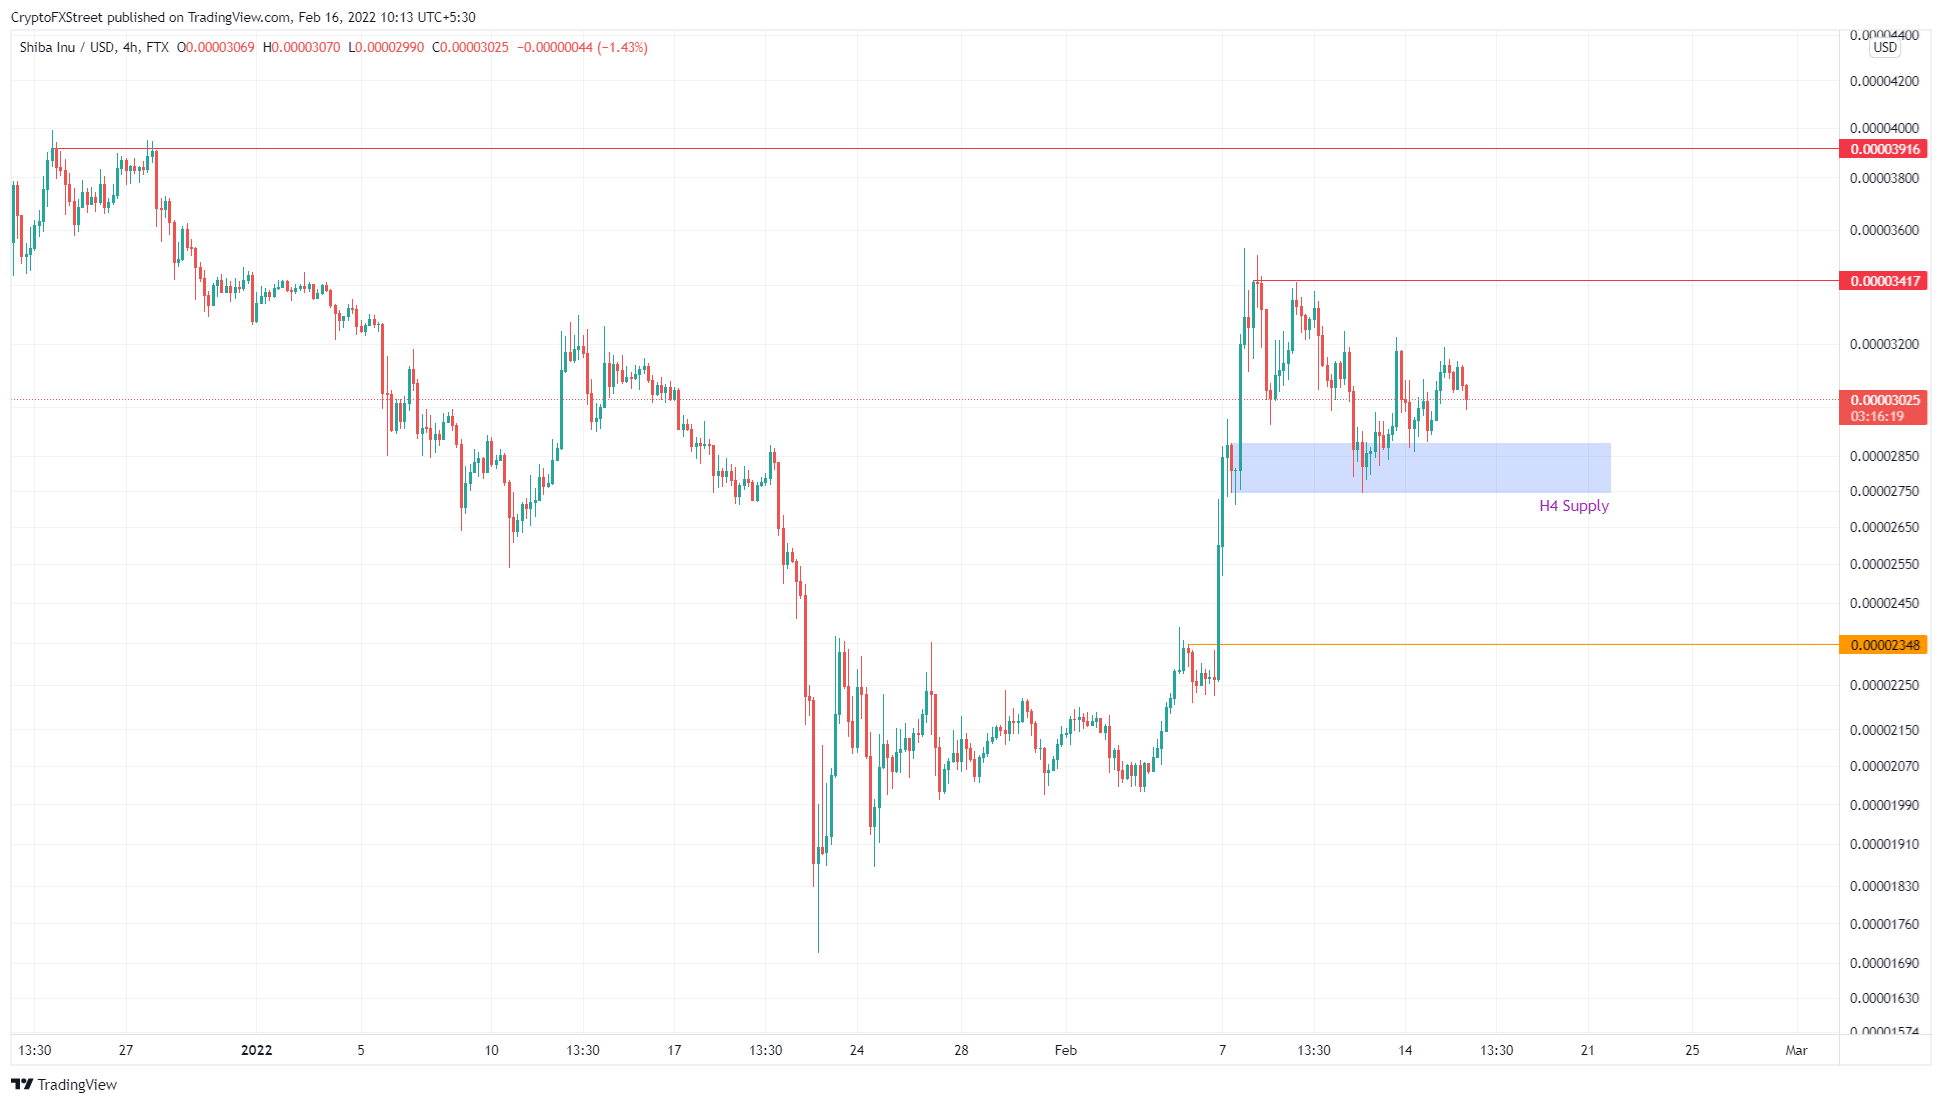
SHIB/USDT 4-hour chart
Supporting this short-term bearish thesis for Shiba Inu price is IntoTheBlock’s Global In/Out of the Money (GIOM) model. This on-chain index shows that the next stable support level extends from $0.0000150 to $0.0000220. Here, roughly 134,230 addresses purchased 502.58 trillion SHIB tokens.
These holders are likely to accumulate more tokens if the price comes down to the mentioned ranges, and it is likely where Shiba Inu price will form a base during a downtrend.
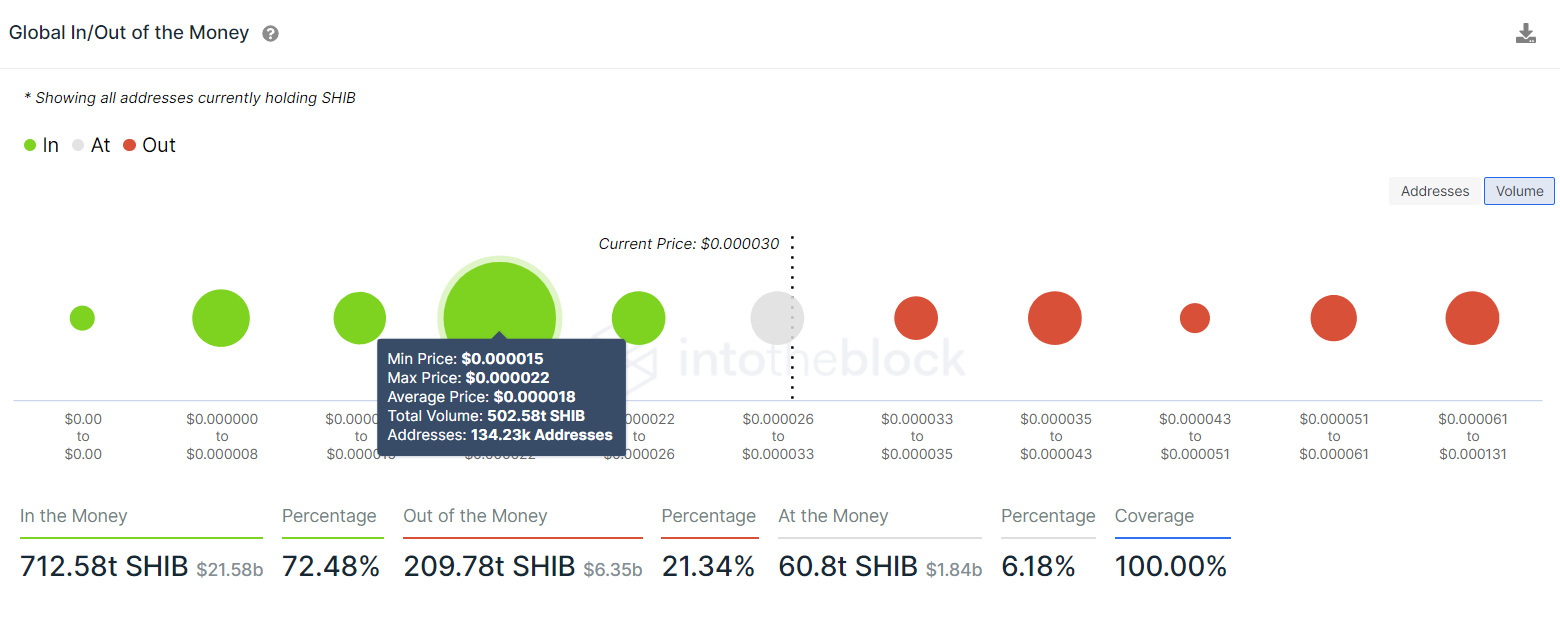
SHIB GIOM
Further adding credence to a short-term bearish thesis is the 30-day Market Value to Realized Value (MVRV) model.
This on-chain metric is used to determine the average profit/loss of investors that purchased SHIB over the past month. Currently, MVRV is hovering at 12.4%, suggesting that these investors are in profit and are likely to pose a threat of a sell-off if they decide to book profits.
 [10.22.37, 16 Feb, 2022]-637805850865189247.png)
SHIB 30-day MVRV
On the other hand, if Shiba Inu price bounces off the $0.0000274 to $0.0000289 demand barrier, to create a four-hour candlestick close above $0.0000342, it will invalidate the bearish thesis.
This development suggests that the bulls are in control and are likely to push Shiba Inu price by 15% to $0.0000392.
Author

Akash Girimath
FXStreet
Akash Girimath is a Mechanical Engineer interested in the chaos of the financial markets. Trying to make sense of this convoluted yet fascinating space, he switched his engineering job to become a crypto reporter and analyst.



