- Red flags for Shiba Inu as three bearish strikes are putting SHIB on track for a 17% loss.
- Markets, in general, are moving into hibernation mode to overcome the rising tensions in Ukraine.
- Expect the downtrend to continue until the floor is reached at around $0.00002100.
Shiba Inu (SHIB) price action is under the scrutiny of bears as bulls have given away their upper hand and are falling over each other to get out of SHIB price action as it tanks for a third consecutive day. With three bearish signals on the technical front and failed peace talks again between Russia and Ukraine, the background looks set for more downturns to come. From the opening price today, SHIB price action is set to correct another 17% before the current intermediary floor is reached for a test of $0.00002100.
SHIB price action is going along with global markets and sees safe-haven bids outweigh the upside potential
Shiba Inu price action is under siege by bears after a series of bearish coups overtook price action. On Wednesday, the first negative signal came from a false break and bull trap, at $0.00002707 and the monthly pivot. Bulls broke above but got washed out of their positions by bears, pushing price action below the 55-day Simple Moving Average (SMA) at $0.00002600. The SMA in its turn again triggered a rejection at the top side on Thursday with bulls being squeezed out of their positions.
The pain for SHIB bulls looks far from over as in early morning trading during the ASIA PAC session, strike three was delivered with a break below the low of yesterday, leading to price action dangling above an abyss of around 17%. The first and only real solid support to the downside is at around $0.00002100, with the green ascending trendline holding five solid tests proving that it is a line in the sand where bulls will engage in full force to uphold price action from falling further. The psychological $0.00002000 should add to the strength of the level, but an eventful weekend could see a further crackdown towards $0.00001883 at the monthly S1 support level.
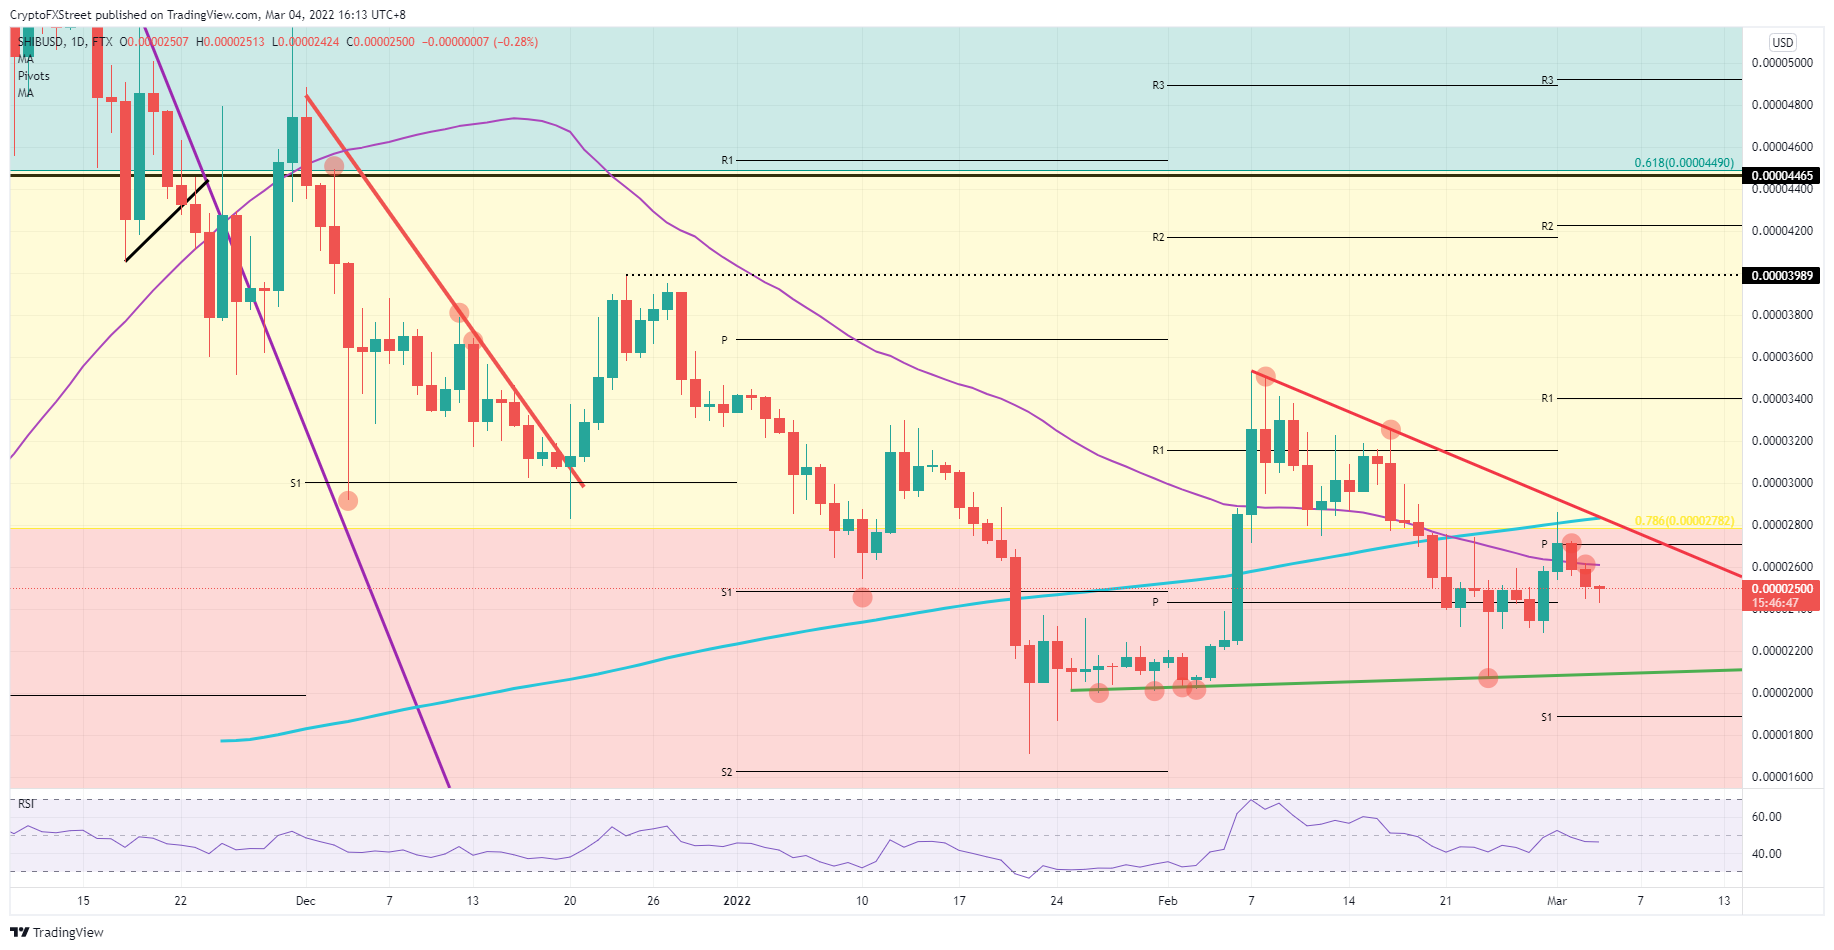
SHIB/USD daily chart
As said in the introductory statement, all this results from the Ukraine situation and global markets further going into safe-haven mode. All it would take are just some flairs of positive news alluding to a solution in Ukraine that would trigger a quick and smooth turnaround back towards $0.00002800. With that move, not only would the red descending trend line at the top side be broken, but as well the 78.6% Fibonacci level would come into play, opening the door for more upside to come.
Information on these pages contains forward-looking statements that involve risks and uncertainties. Markets and instruments profiled on this page are for informational purposes only and should not in any way come across as a recommendation to buy or sell in these assets. You should do your own thorough research before making any investment decisions. FXStreet does not in any way guarantee that this information is free from mistakes, errors, or material misstatements. It also does not guarantee that this information is of a timely nature. Investing in Open Markets involves a great deal of risk, including the loss of all or a portion of your investment, as well as emotional distress. All risks, losses and costs associated with investing, including total loss of principal, are your responsibility. The views and opinions expressed in this article are those of the authors and do not necessarily reflect the official policy or position of FXStreet nor its advertisers. The author will not be held responsible for information that is found at the end of links posted on this page.
If not otherwise explicitly mentioned in the body of the article, at the time of writing, the author has no position in any stock mentioned in this article and no business relationship with any company mentioned. The author has not received compensation for writing this article, other than from FXStreet.
FXStreet and the author do not provide personalized recommendations. The author makes no representations as to the accuracy, completeness, or suitability of this information. FXStreet and the author will not be liable for any errors, omissions or any losses, injuries or damages arising from this information and its display or use. Errors and omissions excepted.
The author and FXStreet are not registered investment advisors and nothing in this article is intended to be investment advice.
Recommended Content
Editors’ Picks
Ripple's move above this key level could trigger nearly 50% rally for XRP
Ripple has overcome a critical resistance level and flipped into a support floor on the weekly time frame. This development happened while XRP tightly consolidated for roughly 250 days. Investors can expect XRP to kickstart a massive rally.
Optimism price outlook with nearly $90 million worth of OP tokens flooding markets on Friday
Optimism volatility has shrunk in the ours leading to the network’s cliff unlock. It joins the likes of dYdX and Sui, which have similar events on their calendars. As token unlocks are often considered bearish catalysts, investors should brace for a reaction after the event.
Top 3 Price Prediction Bitcoin, Ethereum, Ripple: Retail watches from the sidelines with a bias for shorts
Bitcoin could clear $73,777 peak as BTC bulls resurface. Ethereum might fall 10% before next leg up as ETH RSI teases with sell signal. XRP could lose $0.6000 threshold as Ripple bulls fail to show up.
Jito price could hit $6 as JTO coils up inside this bullish pattern
Jito price action shows a potential cup and handle formation. Based on theoretical measurement rules, a successful breakout could yield a 56% rally to $6.0. A breakdown of the $3.86 support level would create a lower low for JTO and invalidate the bullish thesis.
Bitcoin: BTC may have recovered, but is it out of the woods?
Bitcoin’s (BTC) upward momentum has shown a significant decline for the past two weeks or so. This development led to a bearish signal on the weekly and an uncertain outlook on the monthly.