Shiba Inu price to kickstart 37% climb but SHIB will face multiple challenges
- Shiba Inu price will target the topside trend line of the prevailing chart pattern at $0.00003468 next.
- Slicing above the aforementioned resistance will target a further 51% upswing.
- The bullish outlook will be invalidated if SHIB drops below $0.00002357.
Shiba Inu price could be headed for a significant bullish reversal following the formation of a bullish chart pattern. SHIB will face several tough obstacles before reaching the upper boundary of the prevailing chart pattern. However, a slice above the aforementioned headwind may put another 51% ascent on the radar.
Shiba Inu price targets $0.00003468 next
Shiba Inu price has formed an ascending triangle pattern on the daily chart, projecting a 37% climb toward the upper boundary of the governing technical pattern toward $0.00003468.
Shiba Inu price may face several hurdles before tagging the optimistic target. The first area of resistance will emerge at the 50-day Simple Moving Average (SMA) at $0.00002595, then at the 21-day SMA at $0.00002679.
An additional headwind may appear at the 200-day SMA at $0.00002826, coinciding with the 50% retracement level.
Shiba Inu price will face another obstacle at the 100-day SMA at $0.00003091, intersecting with the 61.8% Fibonacci retracement level.
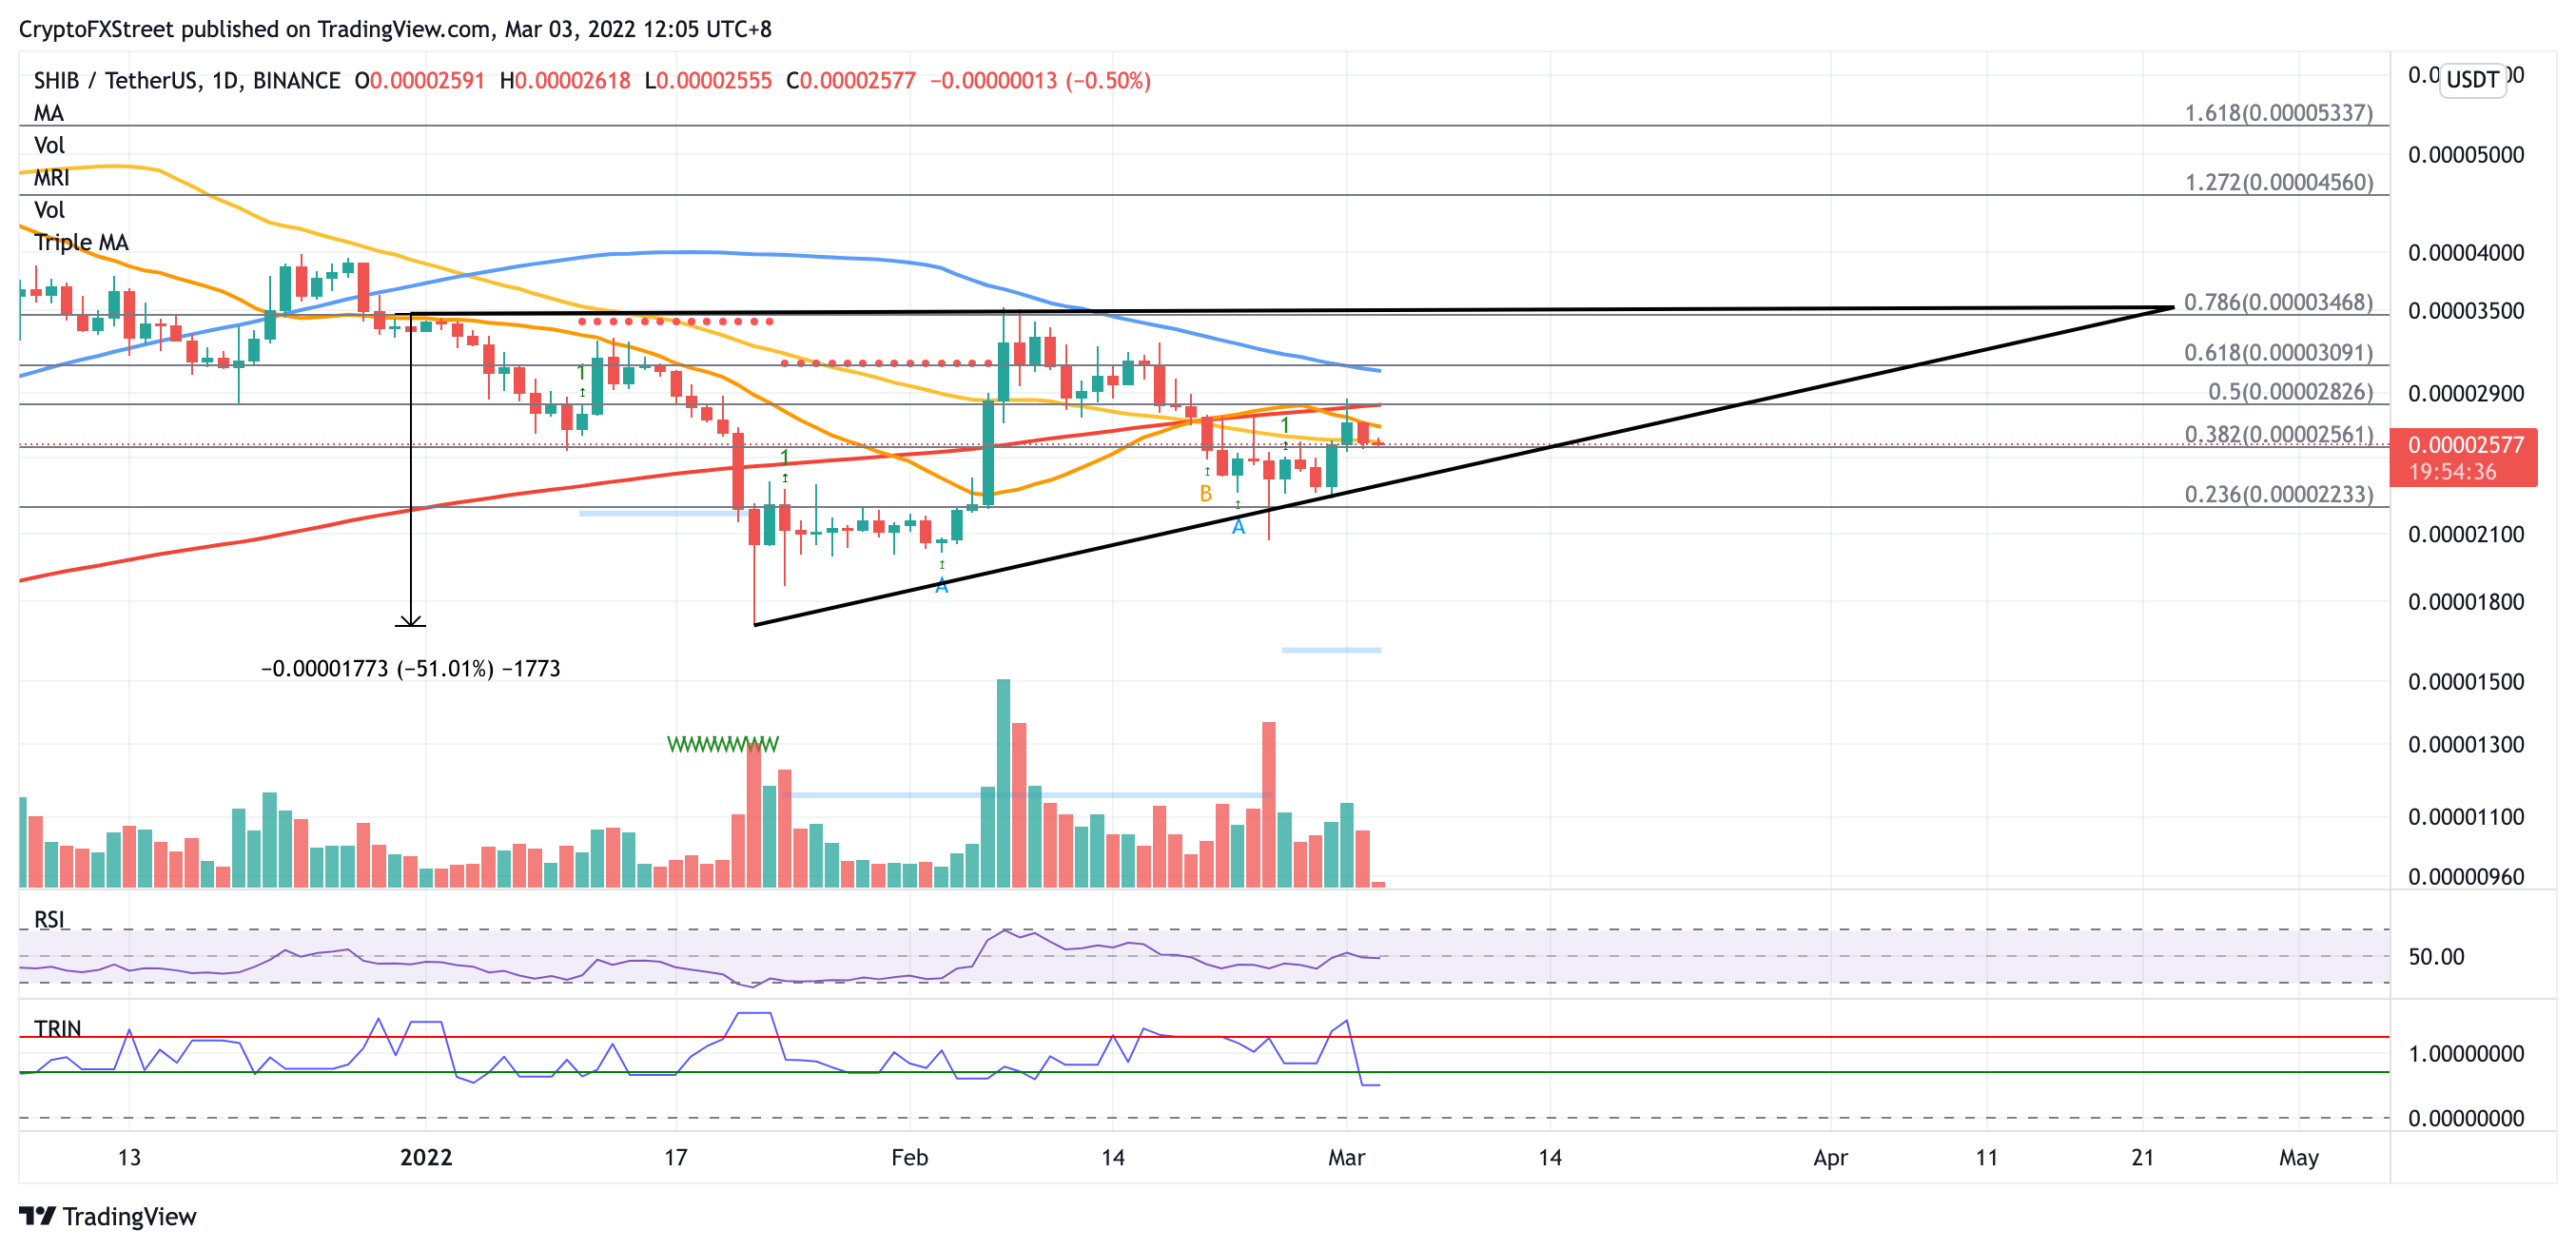
SHIB/USDT daily chart
Only if Shiba Inu price manages to slice above the aforementioned resistances would see SHIB tag the upper boundary of the ascending triangle pattern at $0.00003468, where the 78.6% Fibonacci retracement level also sits.
Investors should note that if buying pressure continues to increase and Shiba Inu price breaks above the topside trend line of the governing technical pattern, a 51% climb toward $0.00005337 would be put on the radar.
If bearish sentiment increases, Shiba Inu price will discover immediate support at the 38.2% Fibonacci retracement level at $0.00002561.
An additional foothold may emerge at the lower boundary of the prevailing chart pattern at $0.00002357.
However, if Shiba Inu price slices below the downside trend line of the governing technical pattern, the optimistic outlook may be invalidated.
Author

Sarah Tran
Independent Analyst
Sarah has closely followed the growth of blockchain technology and its adoption since 2016.


