Shiba Inu downtrend continues, sending 97.4% of SHIB holders underwater
- Shiba Inu price is down 5% in the last 24 hours, extrapolating the downtrend to the demand zone at $0.00000690.
- On-chain metric indicates 97.4% of SHIB holders remain underwater, sitting on unrealized losses as the meme coin records lower lows.
- June 15 lows at $0.00000650 is important in determining beginning of new downtrend as it mark the last lower high.
Shiba Inu (SHIB) prices still on with the load-shedding exercise, increasing its steady stream of lower lows since the month started. With this downtrend, more and more SHIB holders continue to submerge, with the broader meme coin community currently enduring selling pressure.
Also Read: Shiba Inu price lags behind despite massive spike in Shibarium transactions and SHIB token burn
Shiba Inu price drops 5% as meme coins bleed
Shiba Inu (SHIB) price is trading with a bearish bias, alongside its peers, Dogecoin (DOGE), Floki Inu (FLOKI), and Bone ShibaSwap (BONE), as the meme coin community bleeds.
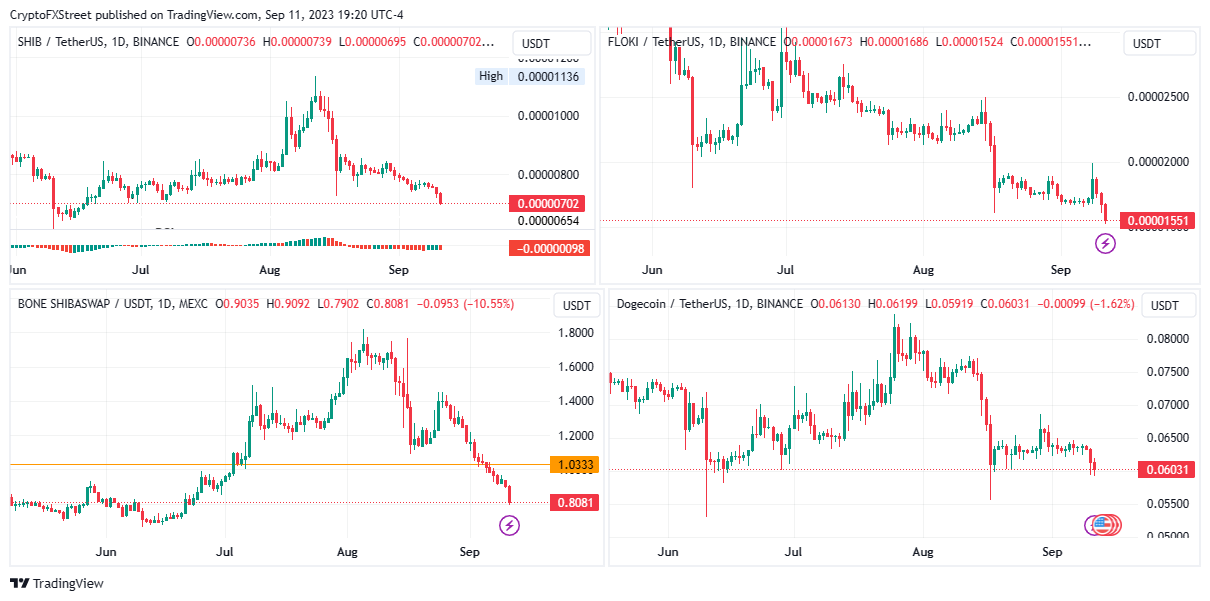
SHIB/USDT 1-day chart, FLOKI/SHIB 1-day chart, BONE/USDT 1-day chart, DOGE/USDT 1-day chart
With memecoins kicking investors out of profit, it remains unclear why the tokens are losing value, save for the broader market dump with Bitcoin price showing weakness.
Increased selling pressure could see Shiba Inu price drop below the equal lows at $0.00000690 into the demand zone where bulls abound. Failure of this order block to sustain as a support floor could expose SHIB to more losses, with the likelihood of a slip below the lower boundary of the demand zone at $0.00000650. Such a move would increase the odds of a prolonged downtrend, potentially facilitating a liquidity sweep before a possible pullback.
The Relative Strength Index (RSI) taking a nosedive points to falling momentum, corroborated by the negative Awesome Oscillator, whose histogram bars are turning red to show bearish takeover. Meanwhile, the Exponential Moving Averages (EMA) are also mirroring the price action, suggesting increased overhead pressure.
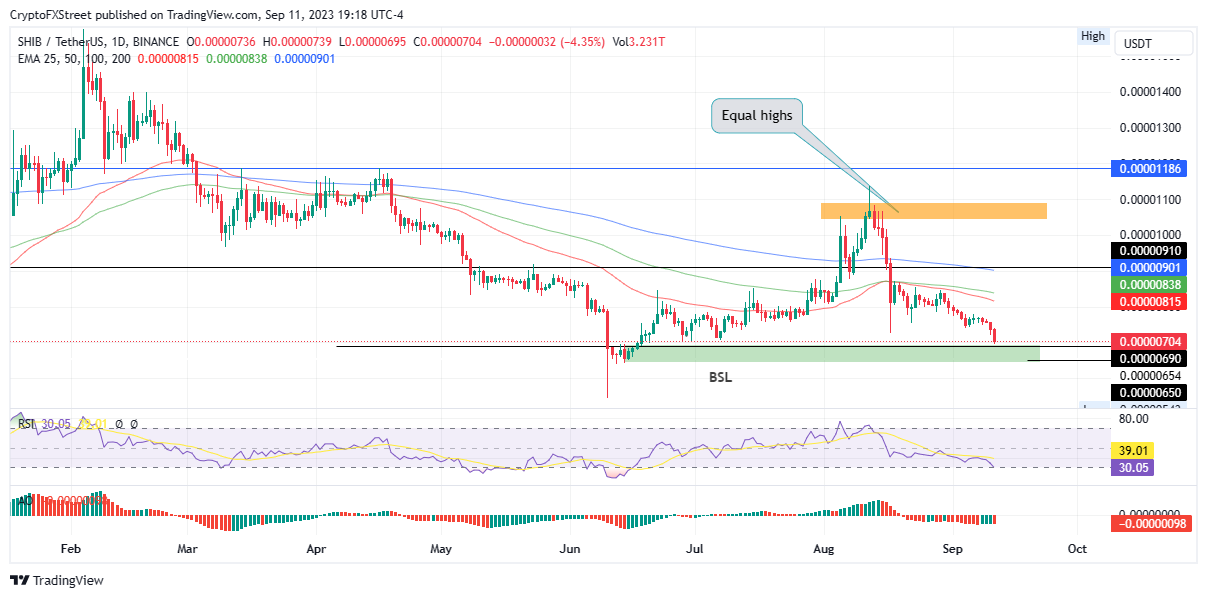
SHIB/USDT 1-day chart
Data from IntoTheBlock’s Global In/Out of the Money shows that the slump has sent almost all SHIB holders under water. Specifically, up to 97.40% of token holders are sitting in unrealized losses (out of the money), against a meager 0.12% that is within the unrealized profit range (in the money). On the other hand, only 2.48% are breaking even (at the money).
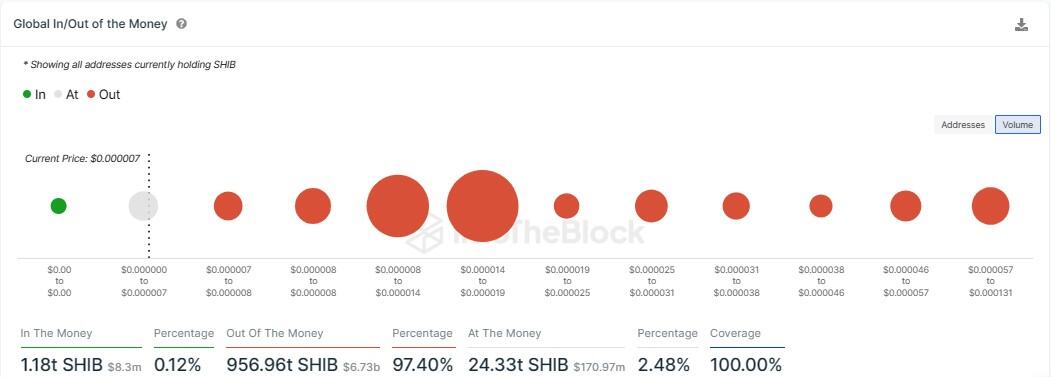
SHIB GIOM
With this outlook, there are three possible scenarios. First, traders could start selling to avoid the risk of further losses as Shiba Inu price points to further decline. Secondly, the share of addresses out of the money could wait until they break even to start selling. These two scenarios add to the headwinds that could enhance the downtrend for SHIB.
Thirdly, with more addresses sitting on unrealized losses compared to the ones in profit, selling pressure could remain low as traders play the long game. A recovery scenario would see Shiba Inu price rise to confront the 50- and 100-day EMAs at $0.00000815 and $0.00000838 respectively, before a possible extrapolation to the resistance confluence between the horizontal line and the 200-day EMA at around $0.00000901.
Bitcoin, altcoins, stablecoins FAQs
What is Bitcoin?
Bitcoin is the largest cryptocurrency by market capitalization, a virtual currency designed to serve as money. This form of payment cannot be controlled by any one person, group, or entity, which eliminates the need for third-party participation during financial transactions.
What are altcoins?
Altcoins are any cryptocurrency apart from Bitcoin, but some also regard Ethereum as a non-altcoin because it is from these two cryptocurrencies that forking happens. If this is true, then Litecoin is the first altcoin, forked from the Bitcoin protocol and, therefore, an “improved” version of it.
What are stablecoins?
Stablecoins are cryptocurrencies designed to have a stable price, with their value backed by a reserve of the asset it represents. To achieve this, the value of any one stablecoin is pegged to a commodity or financial instrument, such as the US Dollar (USD), with its supply regulated by an algorithm or demand. The main goal of stablecoins is to provide an on/off-ramp for investors willing to trade and invest in cryptocurrencies. Stablecoins also allow investors to store value since cryptocurrencies, in general, are subject to volatility.
What is Bitcoin Dominance?
Bitcoin dominance is the ratio of Bitcoin's market capitalization to the total market capitalization of all cryptocurrencies combined. It provides a clear picture of Bitcoin’s interest among investors. A high BTC dominance typically happens before and during a bull run, in which investors resort to investing in relatively stable and high market capitalization cryptocurrency like Bitcoin. A drop in BTC dominance usually means that investors are moving their capital and/or profits to altcoins in a quest for higher returns, which usually triggers an explosion of altcoin rallies.
Author

Lockridge Okoth
FXStreet
Lockridge is a believer in the transformative power of crypto and the blockchain industry.


