Shiba Inu price uptrend limited by 94% of SHIB wallets currently underwater
- Shiba Inu price is nurturing an uptrend, recording higher lows over the last three days amid growing momentum.
- SHIB could rise 10% with the first opposition presented by the 50-day EMA at $0.00000828.
- However, the uptrend is barely sustainable with 93.65% of wallets currently suffering losses.
Shiba Inu (SHIB) price is trading with a bullish bias after a steep 10% fall beginning in late August. After finding support, the meme coin is brewing an uptrend. However, it faces strong opposition from the many addresses looking to close their positions to avoid suffering more losses.
Also Read: Dogecoin likely in the accumulation phase with 20% DOGE wallets sitting on unrealized profits
Shiba Inu price lifts off
Shiba Inu (SHIB) price is rising, up almost 5% in the last three days, with the Relative Strength Index (RSI) momentum indicator showing growing optimism. If sustained, SHIB could make an 8% recovery to confront the first hurdle at $0.00000828, presented by the 50-day Exponential Moving Average (EMA).
In a highly bullish case, Shiba Inu price could overcome this barricade, and the next level at $0.00000846 before confronting the resistance confluence between the horizontal line and the 200-day EMA at $0.00000908. Such a move would denote a 20% climb above current levels.
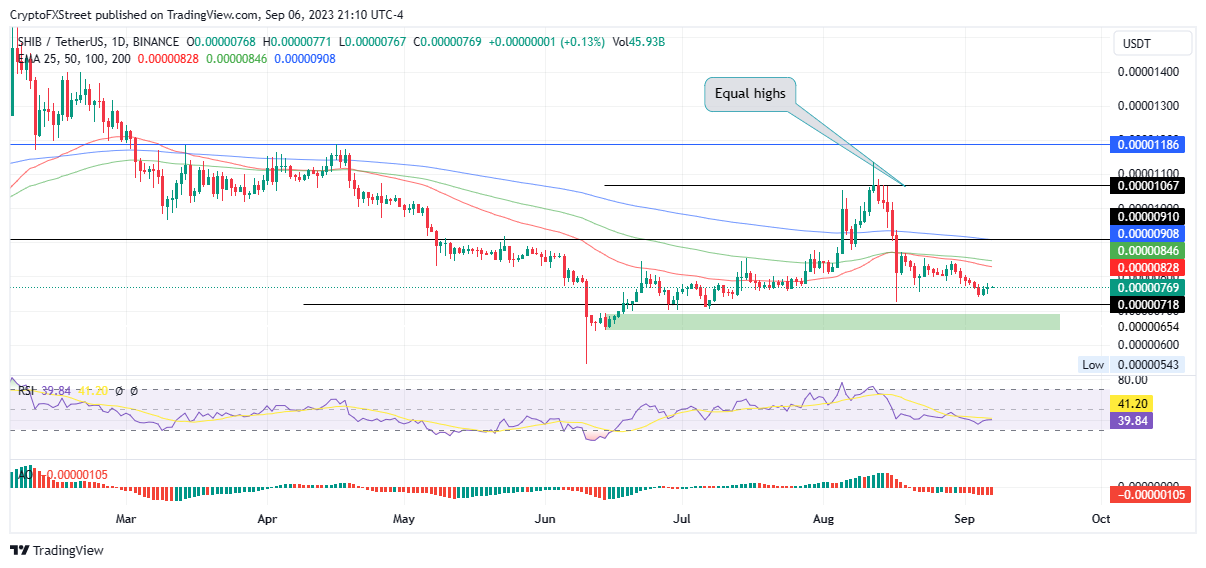
SHIB/USDT 1-day chart
SHIB on-chain metrics say otherwise
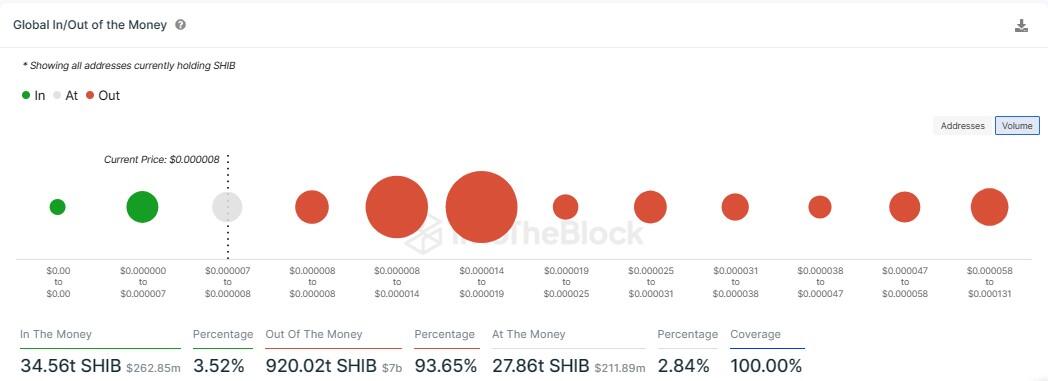
While the ascent seems plausible for SHIB, abounding overhead selling pressure will not allow it. According to the on-chain metric Global In/Out of the Money (GIOM) from crypto intelligence tracker IntoTheBlock, at the current price of $0.00000769, 93.65% of the addresses are currently underwater (out of the money). Only 3.52% is sitting on unrealized profit (in the money) while 2.84% are breaking even (at the money).
DOGE wallet addresses in the profit vs. making losses
With more addresses currently making losses, two scenarios are present. They either will exit the market once they break even, or will play the long game, giving Shiba Inu price the chance to recover.
Santiment data’s active deposit and exchange inflow metrics have recorded significant increases, with the trajectory often pointing to the intention to sell. When holders move their assets to exchanges, it is often because they plan to liquidate them for cash or trade them for better prospects.
 [04.35.45, 07 Sep, 2023]-638296481859790564.png)
SHIB Santiment data active deposit, exchange inflow
The ensuing selling pressure from the 920.02 trillion addresses (or part of them) looking to escape further losses, could see Shiba Inu price decline, possibly retracing to the $0.00000718 support level.
In the dire case, SHIB could extend to the demand zone at around $0.00000687. Chances of another attempt north could present here, where buying pressure is expected.
Cryptocurrency metrics FAQs
What is circulating supply?
The developer or creator of each cryptocurrency decides on the total number of tokens that can be minted or issued. Only a certain number of these assets can be minted by mining, staking or other mechanisms. This is defined by the algorithm of the underlying blockchain technology. Since its inception, a total of 19,445,656 BTCs have been mined, which is the circulating supply of Bitcoin. On the other hand, circulating supply can also be decreased via actions such as burning tokens, or mistakenly sending assets to addresses of other incompatible blockchains.
What is market capitalization?
Market capitalization is the result of multiplying the circulating supply of a certain asset by the asset’s current market value. For Bitcoin, the market capitalization at the beginning of August 2023 is above $570 billion, which is the result of the more than 19 million BTC in circulation multiplied by the Bitcoin price around $29,600.
What is trading volume?
Trading volume refers to the total number of tokens for a specific asset that has been transacted or exchanged between buyers and sellers within set trading hours, for example, 24 hours. It is used to gauge market sentiment, this metric combines all volumes on centralized exchanges and decentralized exchanges. Increasing trading volume often denotes the demand for a certain asset as more people are buying and selling the cryptocurrency.
What is funding rate?
Funding rates are a concept designed to encourage traders to take positions and ensure perpetual contract prices match spot markets. It defines a mechanism by exchanges to ensure that future prices and index prices periodic payments regularly converge. When the funding rate is positive, the price of the perpetual contract is higher than the mark price. This means traders who are bullish and have opened long positions pay traders who are in short positions. On the other hand, a negative funding rate means perpetual prices are below the mark price, and hence traders with short positions pay traders who have opened long positions.
Author

Lockridge Okoth
FXStreet
Lockridge is a believer in the transformative power of crypto and the blockchain industry.


