Ripple Technical Report: XRP/USD exploring the rabbit hole, eyes on $0.14 – Confluence Detector
- Ripple recovers from the dip at $0.1785 and holds the ground above $0.18.
- XRP/USD risks free-fall to $0.14 if support areas at $0.18 and $0.1785 give in to the selling pressure.

Ripple has been exploring lower levels under $0.20 this June. Over the last 24 hours, the digital asset has dived below several support areas at $0.19, $0.1850 and $0.18. An intraday low has been formed at $0.1785 on Thursday. However, XRP has recovered to trade at $0.1820 at the time of writing.
The cryptoasset is likely to contain the losses above $0.18 as long as the RSI in the daily range holds above 35. Recovery towards the average would signal possible price action above $0.1850 and $0.19 resistance zones.
Looking at the MACD in the same range, traders cannot ignore the influence sellers have over the price. The indicator is moving sidelong marginally below the midline. A minor bearish divergence highlights the downward pressure, perhaps keeping buyers away from significant upward movement.
On the flip side, if losses continue below $0.18 as well as $0.1785, Ripple could lose any chances of recovery until it finds balance at $0.14 (primary support). Note that in March, XRP plunged to $0.11 due to the Coronavirus-triggered crash across the market. On the brighter side, a fall of such extent could increase the demand for the token and eventually catapult it above $0.20.
Related content: Cryptocurrency Market Update: Bloodbath as Bitcoin shoots under $9,000, Ethereum and Ripple bleed
XRP/USD daily chart
 (41)-637286627387997735.png)
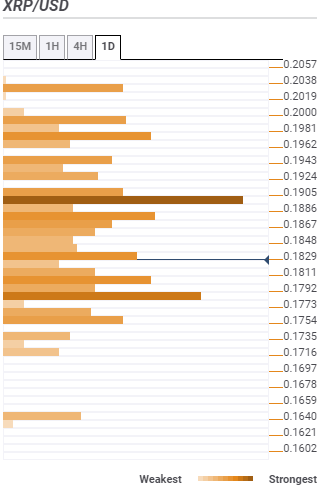
Ripple confluence resistance and support levels
Resistance one: $0.1829 – The region highlights the Bollinger Band 1-hour middle curve, the Fibo 23.6% one-day, the previous high 15-minutes and the SMA 50 15-minutes indicators among others.
Resistance two: $0.1886 – Hosts the Fibo 38.2% one-week, the Bollinger Band 4-hour middle curve, SMA five daily and SMA 100 1-hour.
Resistance three: $0.1950 – This is the strongest resistance zone and is home to the previous high one-day, the SMA 200 1-hour, and SMA ten 1-day.
Support one: $0.1811 – The zone is the initial support and is home to the Bollinger band daily lower curve, SMA ten 15-minutes and the previous low 15-minutes.
Support two: $0.1792 – Highlights the previous low 4-hour, the Bollinger Band 15-minutes lower curve and the previous month low.
Author

John Isige
FXStreet
John Isige is a seasoned cryptocurrency journalist and markets analyst committed to delivering high-quality, actionable insights tailored to traders, investors, and crypto enthusiasts. He enjoys deep dives into emerging Web3 tren


