Polygon price sees MATIC bulls attempting to eke out a rally, as their efforts remain uneventful
- Polygon price booked shy of 3% gains intraday on Wednesday as equities rally during the US session.
- MATIC price is on the backfoot during ASIA PAC and European sessions on Thursday as markets hold their breath before ECB.
- With their first 75 bps hike since 1999, markets are weighing whether the ECB is doing too little too late.

Polygon (MATIC) price will trade at the mercy of ECB traders this afternoon as the European Central Bank is set to announce its first 75 bps hike since 1999. Given already priced in, it will come down to the details of what is contained in the ECB’s communication about the future course of policy and the speech by its chairwoman Christine Lagarde. The key issue here is that the eurozone is already underperforming and could easily fall into a recession, whereas the US is still performing well and thus could see the dollar strengthen substantially further.
MATIC price still has a 25% bearish outlook
Polygon price will not be able to make up its mind today as all eyes are on the ECB this afternoon and, linked to that, the euro and dollar. With plenty of spillover risk, a weaker or stronger dollar could easily determine whether cryptocurrencies go up or down. Based on past performances, the most likely outcome is another leg lower as the ECB fails to communicate a strong message to the markets that is unfavourable for the dollar.
MATIC price is thus set to test the low of this week near $0.791 before ticking the low of August at $0.754. With this big catalyst event, it could well be that the drop gains momentum going into the US session and possibly even hits the S1 monthly pivot at $0.700. Such an outcome is based on a message that is unable to address key issues in the eurozone, making the dollar even more attractive.
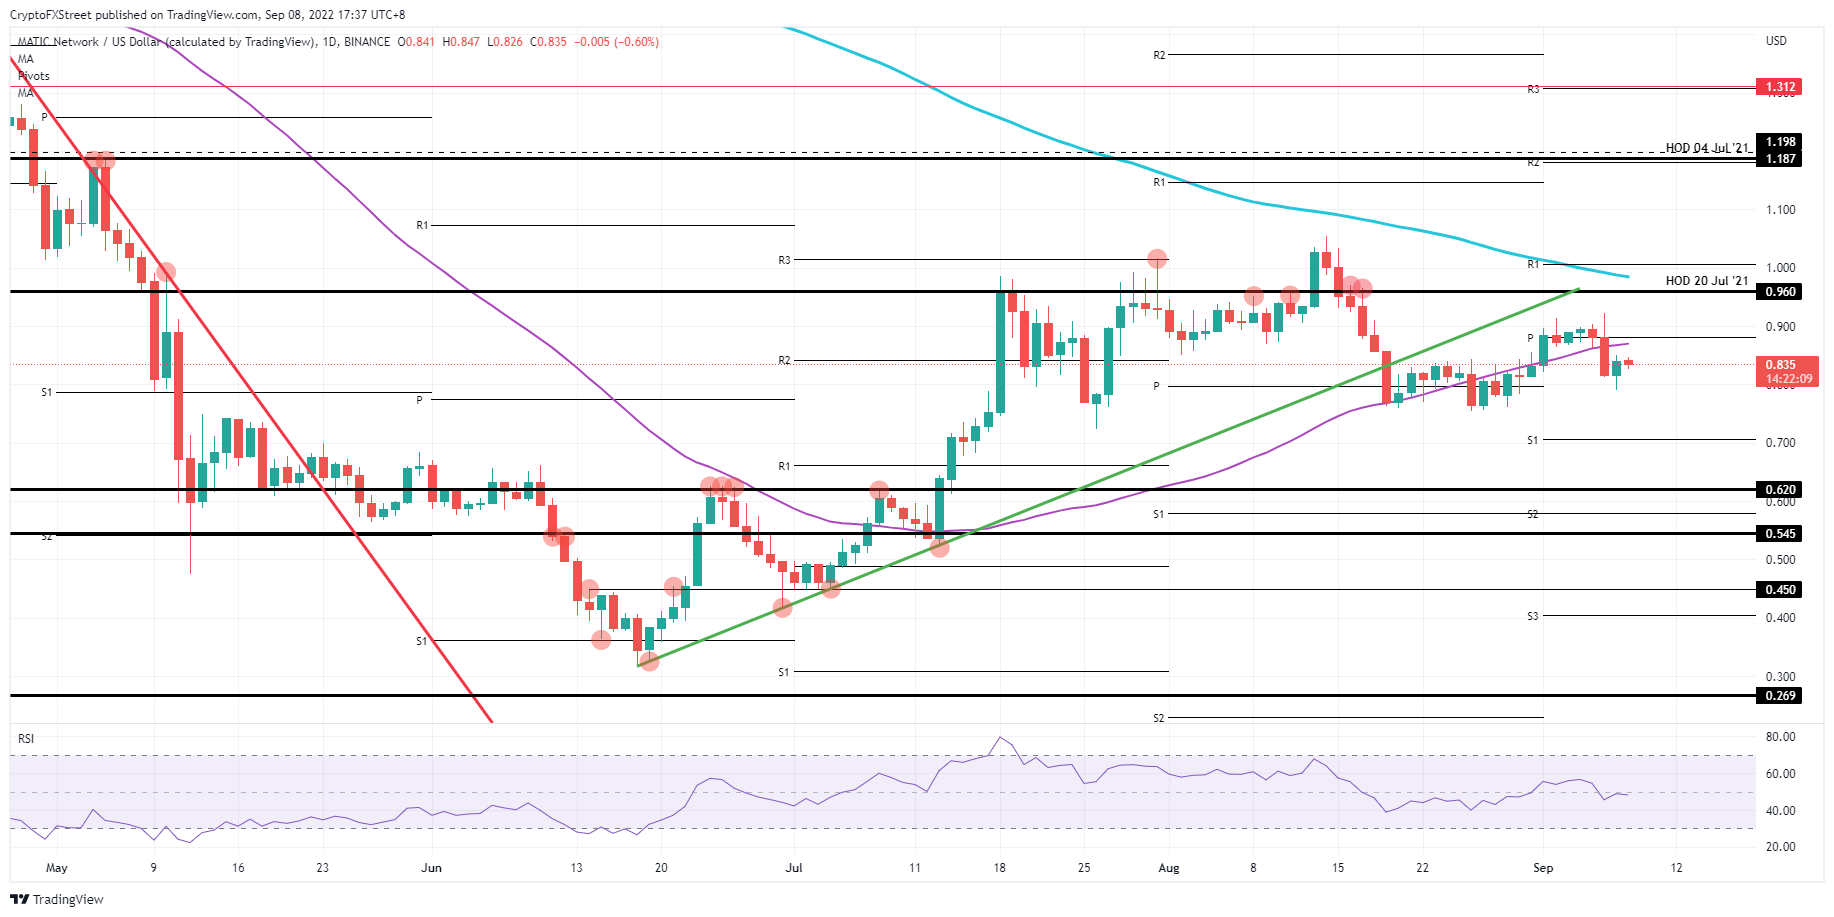
MATIC/USD Daily chart
With price action currently residing in the middle of the high and low of this trading week, it points to traders and investors still standing to one side, ready to rush in quickly should price action shoot up. Once that happens, expect a quick hit-and-run move that, once above the 55-day Simple Moving Average and monthly pivot at $0.880, could see a test of $0.960 in a matter of minutes. Bulls should beware of not falling into a bull trap on a false break above that level, seeing as the 200-day SMA caps to the upside and will offer bears an easy entry-level.
Author

Filip Lagaart
FXStreet
Filip Lagaart is a former sales/trader with over 15 years of financial markets expertise under its belt.



