MATIC price anticipates strong overhead rejection before crashing 30%
- MATIC price shows a tight consolidation after a string of equal lows at $0.758.
- A bounce off this level will likely reach the midpoint at $0.906 before triggering a crash to $0.647 and $0.598.
- A daily candlestick close above $1.048 will invalidate this bearish outlook.

MATIC price is in a range tightening mode after a steep correction last week. This development will likely revert to the mean before establishing a directional bias. Therefore, investors need to exercise caution as the macro trend, which is bearish, could continue.
MATIC price takes control for now
MATIC price dropped roughly 28% between August 14 and August 20 as it slipped from a swing high of $1.048 to $0.758. This downswing created two equal lows at $0.758, bringing the total swing lows formed at the aforementioned level to three.
Instead of sweeping these lows first, MATIC price is consolidating in a tight range. Moreover, the altcoin looks ready to revert to the mean of the 28% crash at $0.906. Assuming this 9.7% bounce does occur, investors should exercise caution and not become a bull with this minor uptrend since a reversal seems logical at $0.906.
The reason for this bearish outlook is that the macro view of the markets is bearish; therefore, this small move is unlikely to trigger a bullish development in MATIC price. Instead, market participants should prepare for an eventual sweep of $0.758 followed by a retest of the $0.673 and $0.598 support levels.
From the midpoint at $0.906, this move would constitute a 30% crash and is likely where Polygon bulls might step in and pause the downtrend.
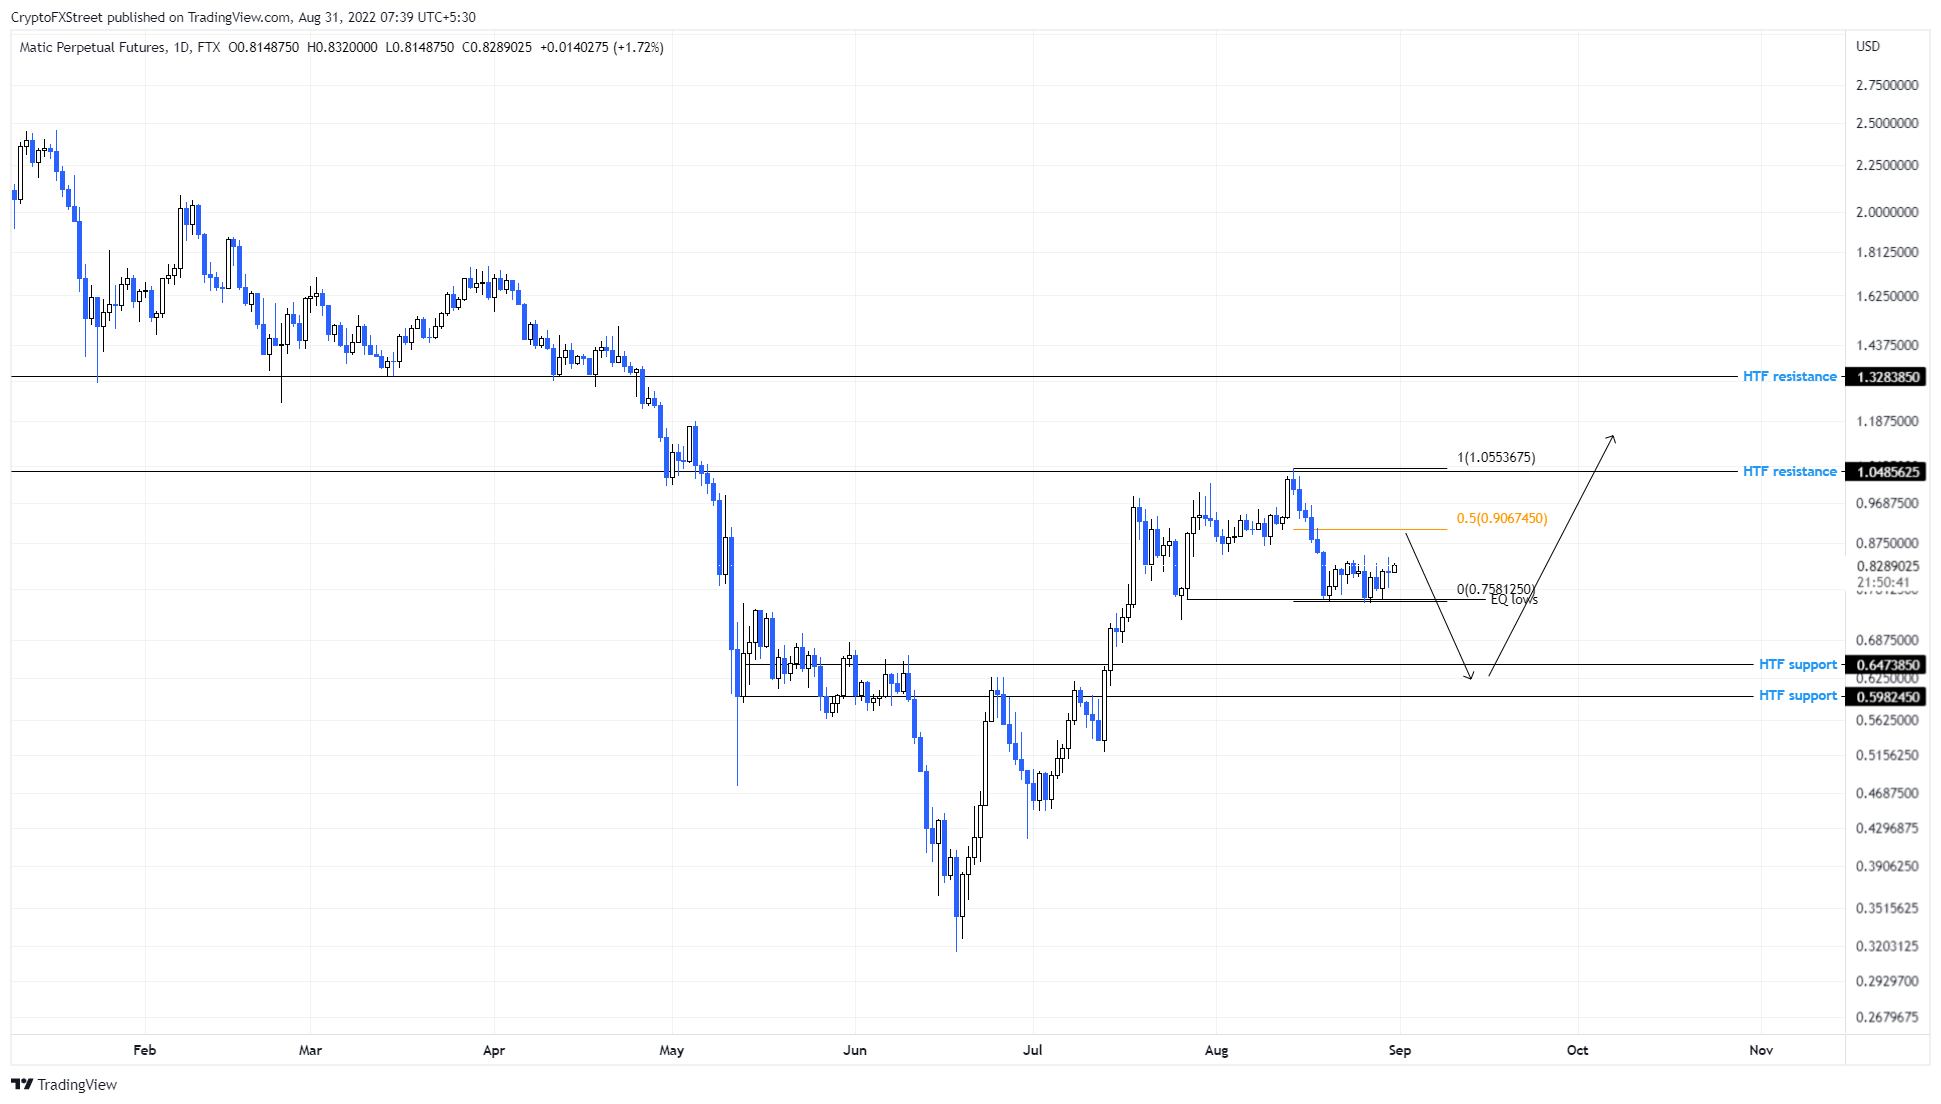
MATIC/USDT 1-day chart
While things are looking bearish for MATIC price, a mean -reversion move into the midpoint at $0.906 could extend up to $0.984, and in some special cases, it could even retest the high-time frame resistance level at $1.048 or the range high at $1.055 before triggering a reversal in trend.
However, if MATIC price produces a daily candlestick close above the range high at $1.048, it will invalidate this bearish outlook by producing a higher high. In such a situation, Polygon might attempt a revisit of $1.328.
Note:
Altcoins have a high correlation to Bitcoin price; hence understanding what BTC is going to do will give traders a massive edge in trading altcoins. The video attached below explains how the big crypto could recover and potentially influence MATIC price movements.
Author

Akash Girimath
FXStreet
Akash Girimath is a Mechanical Engineer interested in the chaos of the financial markets. Trying to make sense of this convoluted yet fascinating space, he switched his engineering job to become a crypto reporter and analyst.



