Polygon price coils up for a recovery rally with 15% gains in sight
- Polygon price has reached its highest since August, recording a 6% surge in a week.
- MATIC could extend 20% to test the supply zone at $0.645, uptrend confirmation above $0.6757.
- Invalidation of the bullish outlook will occur upon a 3-day candlestick close below $0.4894.

Polygon (MATIC) price is coiling up for a move north, after a steady downtrend, as MATIC holders look to push MATIC's value above the $1 mark. Meanwhile, altcoins are leading the crypto market crash, as profit takers engage in full gear. However, there is hope, with prices firing up by speculation on speculation that October has historically been a good trading month.
Also Read: Polygon price sees dip after key executive departure
Polygon price primed for recovery rally
Polygon (MATIC) price is up 6% in the last week and 5% in the fourteen days as it tries to nurture a recovery rally. It comes after a 40% slump, beginning mid-July. Technical indicators such as the Relative Strength Index (RSI) and the Awesome Oscillator (AO) support this outlook.
For starters, the RSI is making its second attempt to test the 50 midline after a recent rejection. Historically the second go has always done it for Polygon price, facilitating a northbound move. Regarding the AO, it has sustained a steady flow of green bars to solidify the growing momentum.
Increased buying pressure above the current price could see Polygon price test the supply zone at $0.6450 to $0.7075. A break and close above its midline at $0.6757, which coincides with the 50-day Exponential Moving Average (EMA), would confirm the uptrend. In a highly bullish case, the gains could see MATIC reclaim above $0.8146, levels last seen on July 15, where the last downtrend commenced.
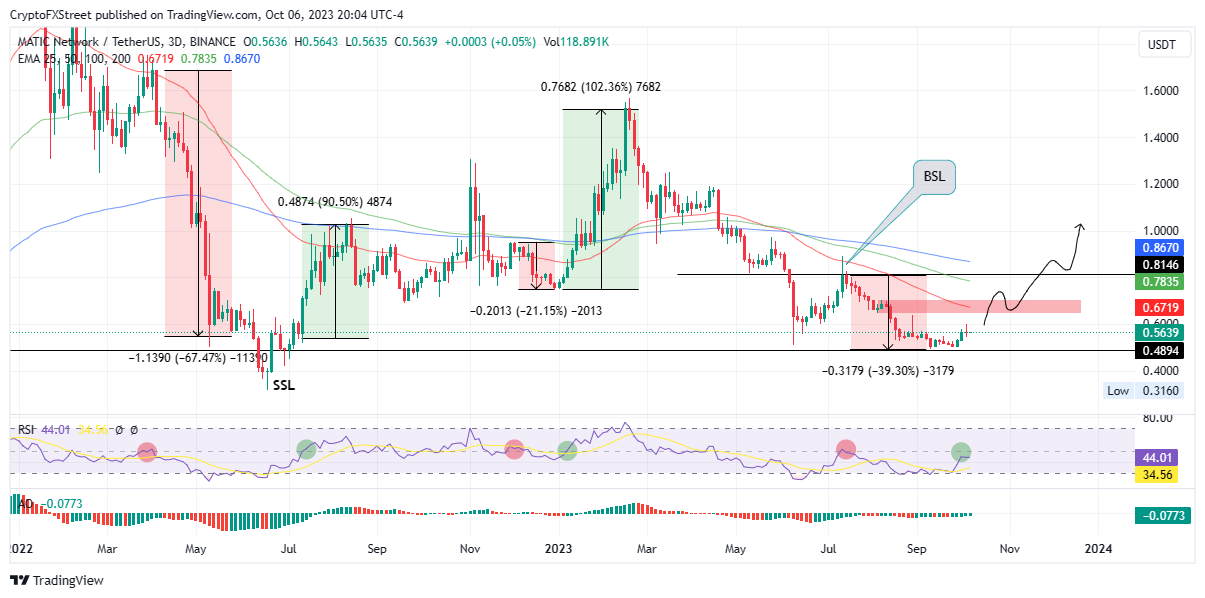
MATIC/USDT 1-day chart
Conversely, a rejection from the supply zone, an area characterized by aggressive selling, could send Polygon price south toward the support floor at $0.4894. A decisive 3-day candlestick close below this level would invalidate the bullish thesis. In the dire case, the slump could send MATIC to the mid-June 2023 depths around $0.3160.
As a side note, investors should be wary of trying to catch a ride on crypto solely on these moments of momentum.
Also Read: Bitcoin Weekly Forecast: BTC recovery rally could be bull trap in disguise, here’s why
Cryptocurrency metrics FAQs
What is circulating supply?
The developer or creator of each cryptocurrency decides on the total number of tokens that can be minted or issued. Only a certain number of these assets can be minted by mining, staking or other mechanisms. This is defined by the algorithm of the underlying blockchain technology. Since its inception, a total of 19,445,656 BTCs have been mined, which is the circulating supply of Bitcoin. On the other hand, circulating supply can also be decreased via actions such as burning tokens, or mistakenly sending assets to addresses of other incompatible blockchains.
What is market capitalization?
Market capitalization is the result of multiplying the circulating supply of a certain asset by the asset’s current market value. For Bitcoin, the market capitalization at the beginning of August 2023 is above $570 billion, which is the result of the more than 19 million BTC in circulation multiplied by the Bitcoin price around $29,600.
What is trading volume?
Trading volume refers to the total number of tokens for a specific asset that has been transacted or exchanged between buyers and sellers within set trading hours, for example, 24 hours. It is used to gauge market sentiment, this metric combines all volumes on centralized exchanges and decentralized exchanges. Increasing trading volume often denotes the demand for a certain asset as more people are buying and selling the cryptocurrency.
What is funding rate?
Funding rates are a concept designed to encourage traders to take positions and ensure perpetual contract prices match spot markets. It defines a mechanism by exchanges to ensure that future prices and index prices periodic payments regularly converge. When the funding rate is positive, the price of the perpetual contract is higher than the mark price. This means traders who are bullish and have opened long positions pay traders who are in short positions. On the other hand, a negative funding rate means perpetual prices are below the mark price, and hence traders with short positions pay traders who have opened long positions.
Author

Lockridge Okoth
FXStreet
Lockridge is a believer in the transformative power of crypto and the blockchain industry.


