Bitcoin Weekly Forecast: BTC recovery rally could be bull trap in disguise, here’s why
- Bitcoin price could be inflating to trap bulls around the $28,000 region.
- On-chain data shows a short-term accumulation could be in play on Binance crypto exchange.
- A decisive flip of the $30,000 psychological level into a support floor will invalidate the bearish thesis.

Bitcoin (BTC) price remains unfazed even after the multiple spot BTC ETF delays from the US Securities & Exchange Commission (SEC). But investors need to be careful with the ongoing BTC rally as it could be a trap for early bulls.
Also read: Enter the Ether: VanEck releases two ETF ads ahead of possible Monday launch
Bitcoin price rise could be deception
Bitcoin (BTC) price is currently close to retesting the 20-week Exponential Moving Average (EMA) as shown in the chart below. The previous article sheds light on a potential fractal that could trigger a massive correction, should history repeat.
Read more: Bitcoin Weekly Forecast: BTC downside likely after 20-week EMA culls bulls
Bitcoin price has more upside before the sellers trap bulls however. As seen in March 2022, after the bearish crossover between the 20-week EMA and 200-day Simple Moving Average (SMA), BTC recovered above the 20-week EMA and faced rejection at the hands of the 200-day SMA.
If something similar were to happen now, then short-sellers are likely to wait for Bitcoin price to reach roughly $28,000, so that more longs can pile on.
With the SEC delaying most spot Bitcoin Exchange-Traded Funds (ETF), the bearish news could have already started building up.
Regardless, the technicals do point toward a short-term bullishness for Bitcoin price. Short-term holders, in particular, are already active, as seen in the previous article.
Read more: This short-term Bitcoin holder indicator forecasts another rally for BTC
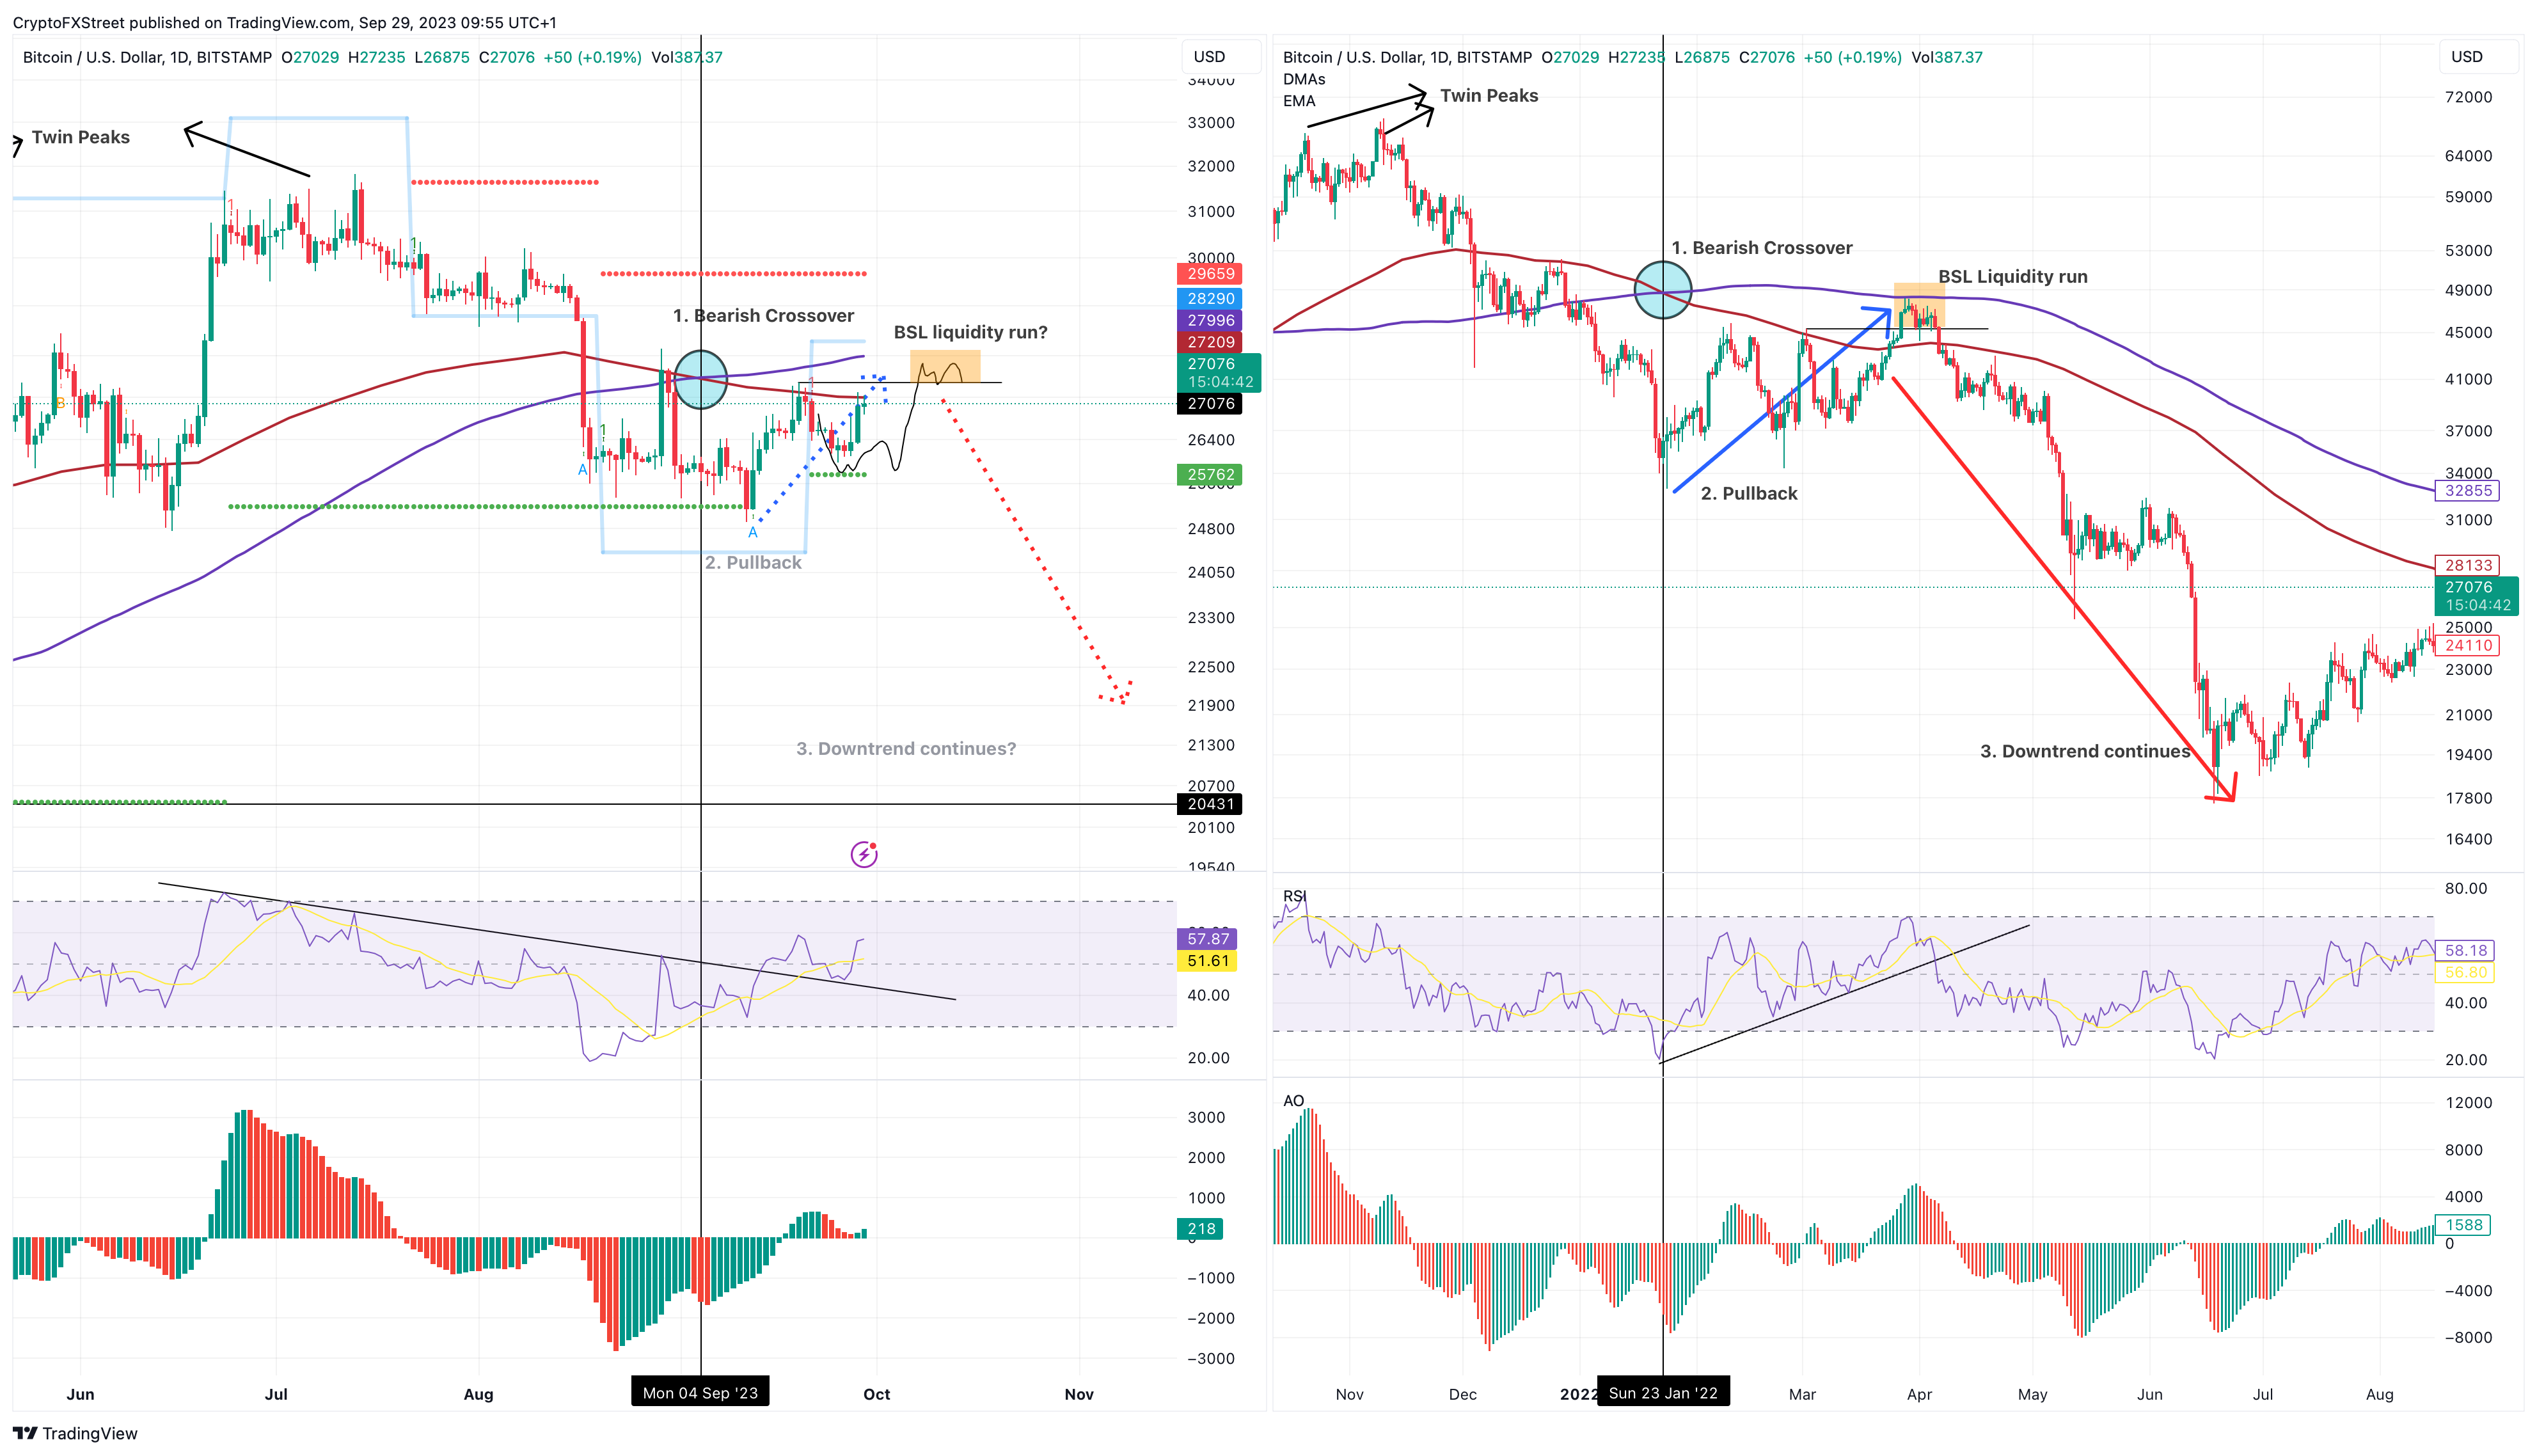
BTC/USD 1-day chart
On-chain data shows short-term accumulation
According to the data analytics firm CryptoQuant, the Taker Buy Sell Ratio indicator on Binance is seeing an uptick. Shortly after this indicator saw spikes in the Taker Buy Sell Ratio at the start of 2023, Bitcoin price kick-started a massive bull rally.
The current spikes could suggest that short-term accumulation might be happening under the hood.
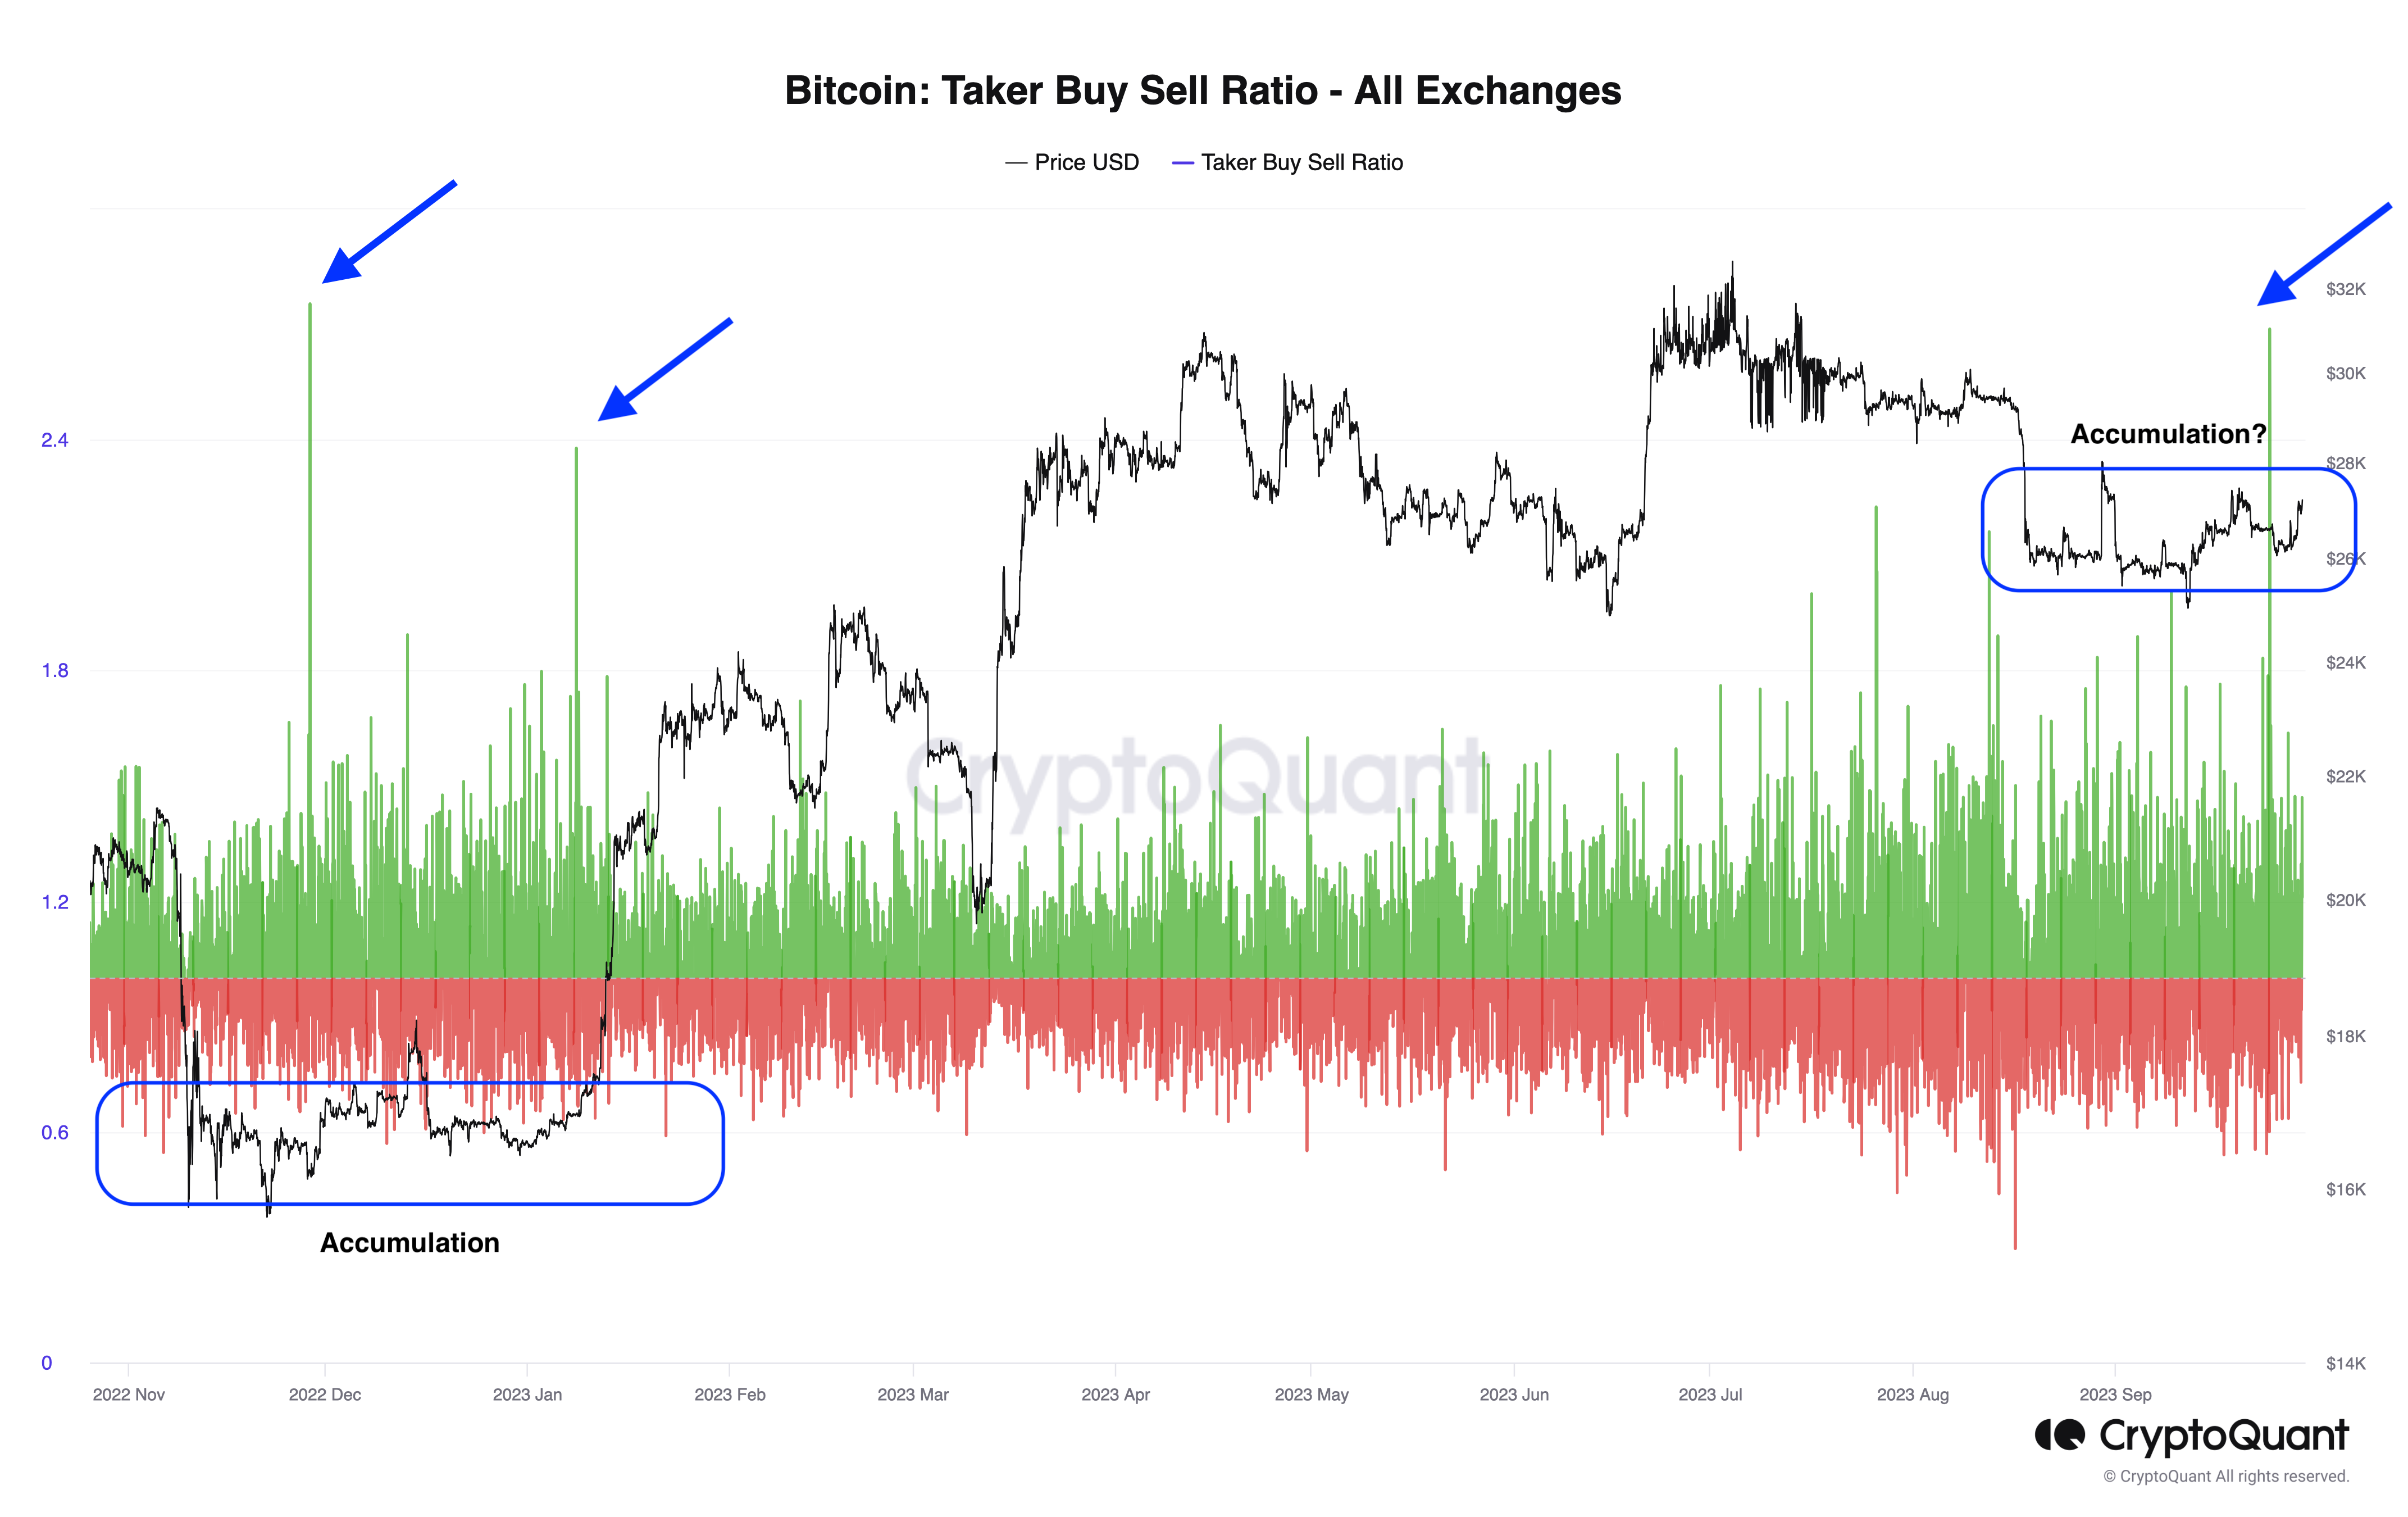
BTC Taker Buy Sell Ratio
Conclusion: Bull Trap disguised in rally or the other way around?
The outlook explored in last week’s article from last week is still in play. Instead of getting rejected at the 20-week EMA, BTC price could retest the 200-day SMA at nearly $28,000 and face a sell-off.
The bull trap should come into play at this level and kickstart a sell-off. But if BTC does extend, then it is probably heading higher to collect the buy-side liquidity around the $30,000 psychological level as shown in the chart below.
But if this is, in fact, a play to trap the bears, then Bitcoin price should flip the $30,000 psychological level and hold above it. In such a case, sidelined buyers could jump to accumulate, pushing BTC higher to potentially $35,000.
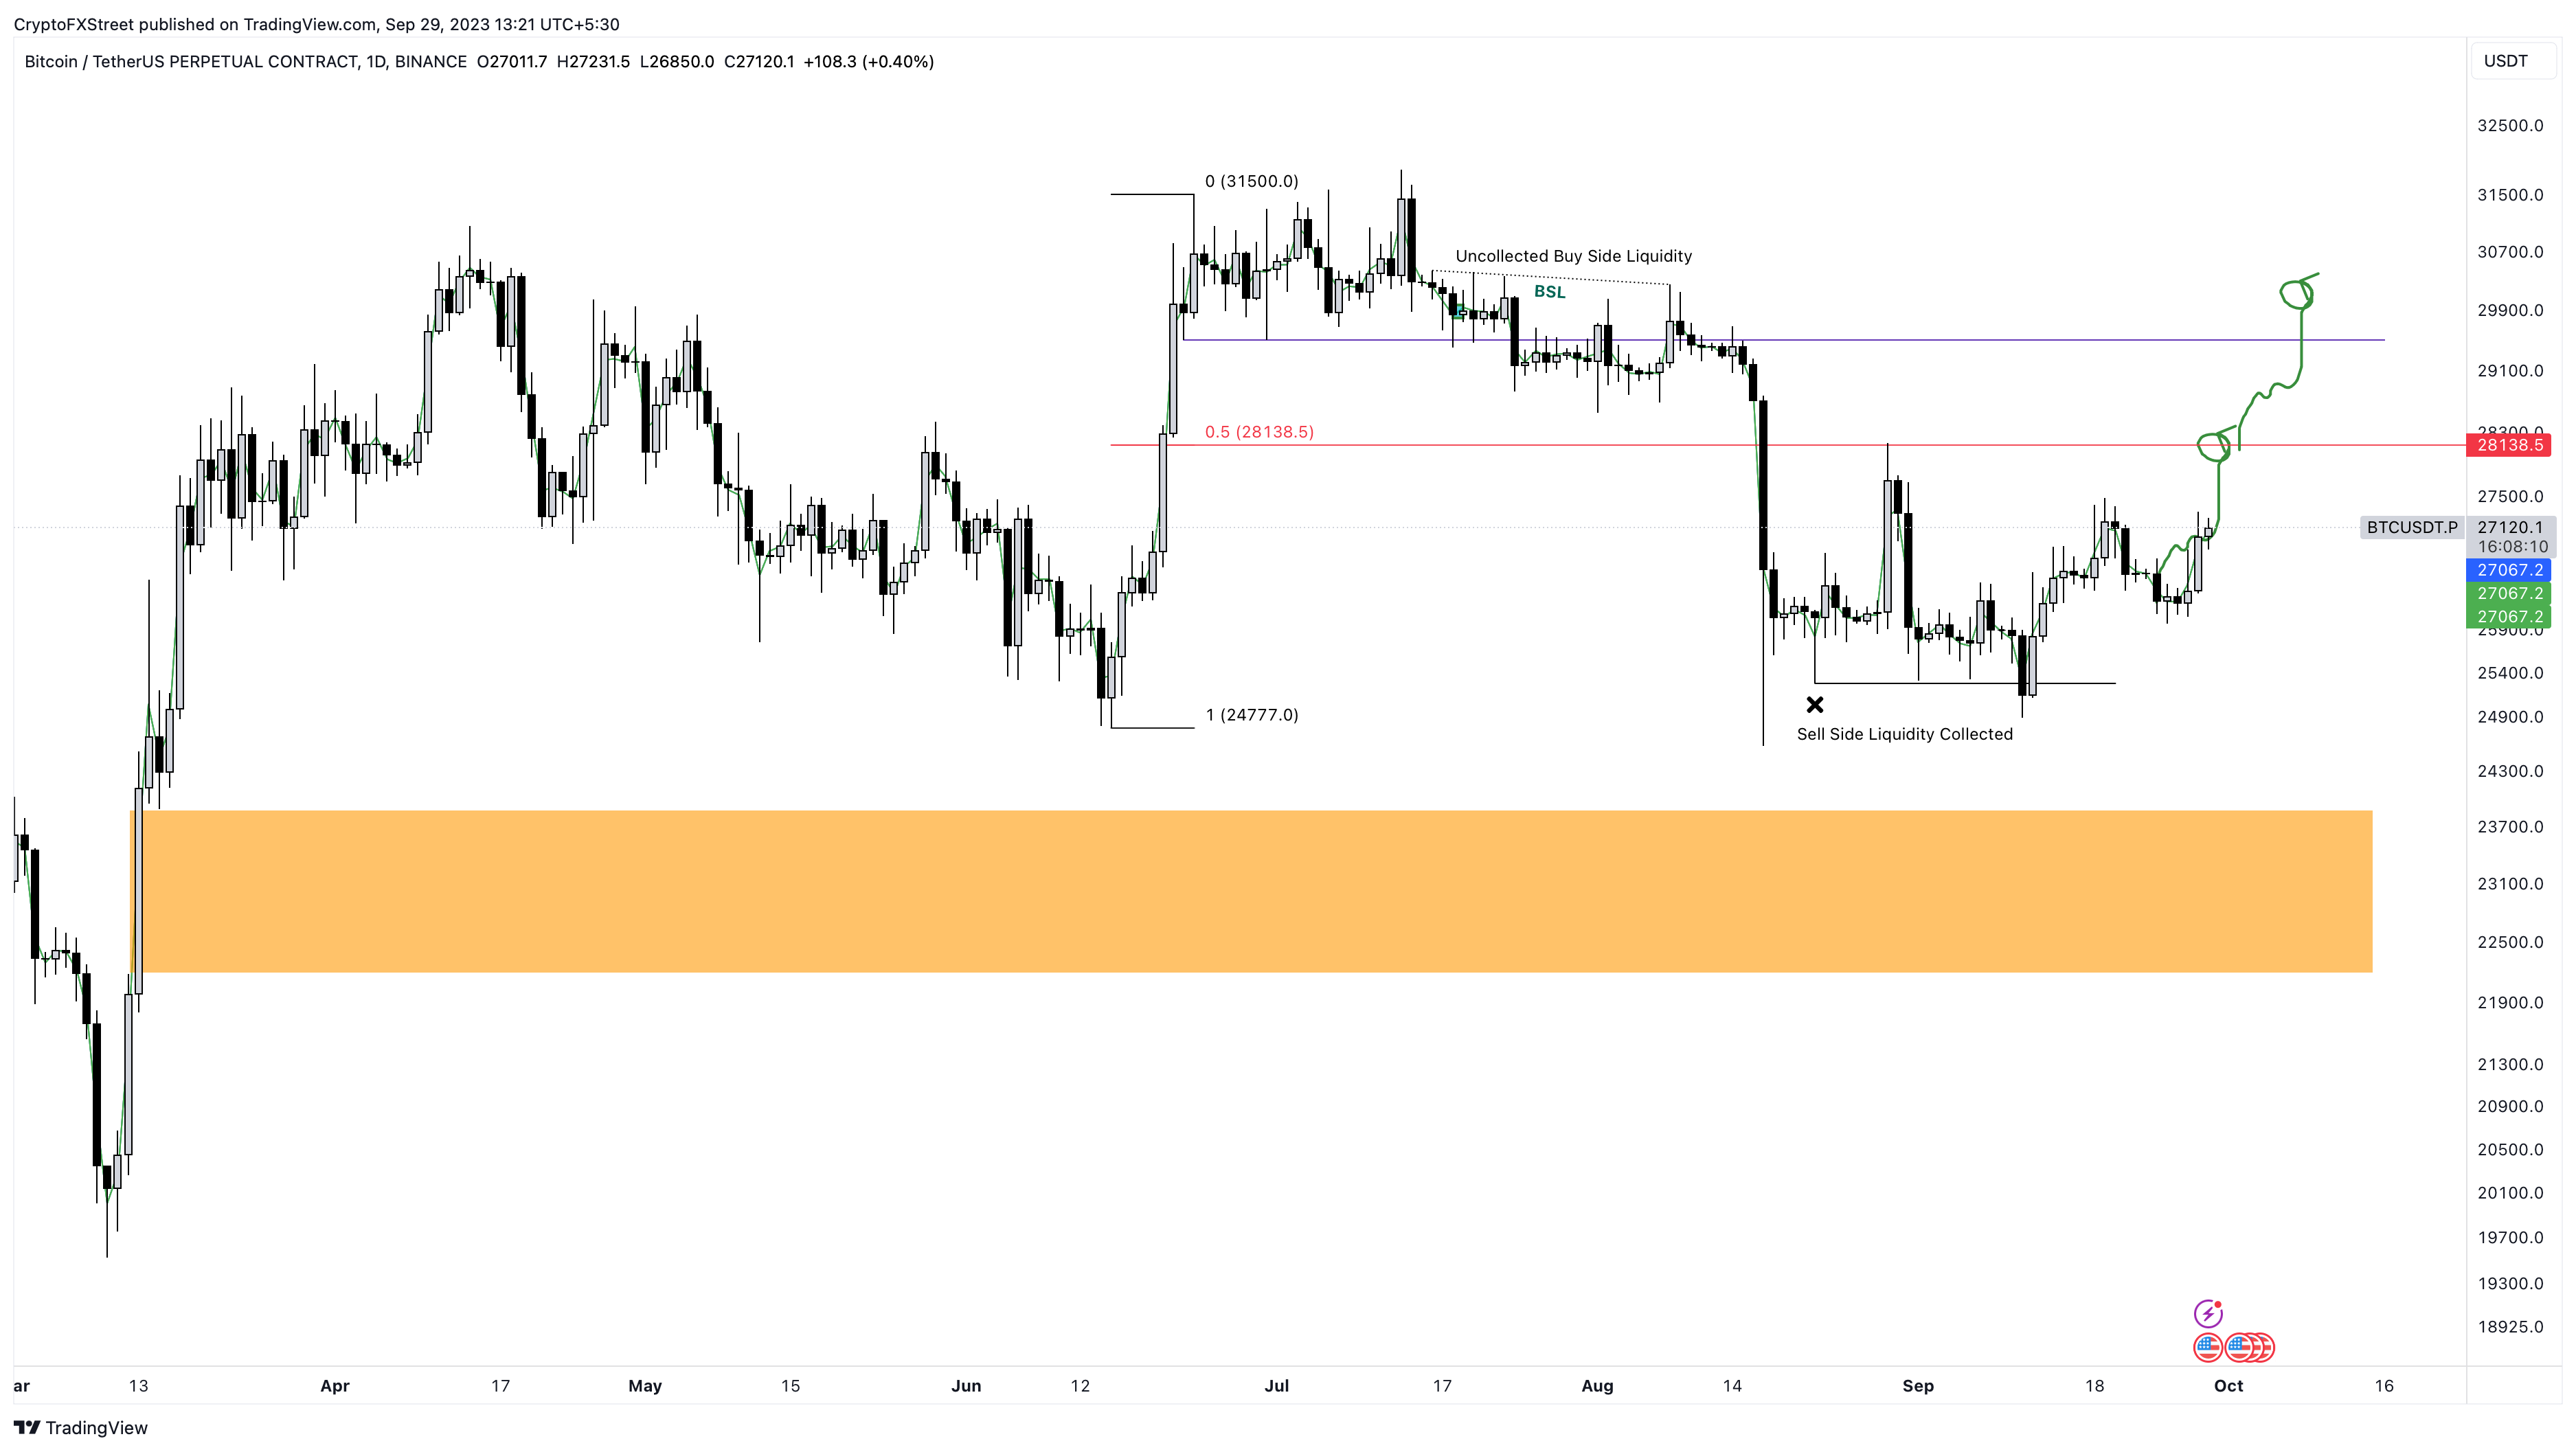
BTC/USDT 1-day chart
Author

Akash Girimath
FXStreet
Akash Girimath is a Mechanical Engineer interested in the chaos of the financial markets. Trying to make sense of this convoluted yet fascinating space, he switched his engineering job to become a crypto reporter and analyst.




