Cardano Price Forecast: ADA's recent breakout could trigger 15% rally
- Cardano price rally on Monday suggests that a larger bullish move might be in the works.
- On-chain data shows a comeback in investor interest and entry of institutional investors.
- Investors could reaccumulate ADA if it were to fall to $0.456, the 61.8% Fibonacci retracement level.
- A daily candlestick close below $0.42 would invalidate the bullish thesis, possibly triggering a 7% decline to $0.39.

Cardano (ADA) price could be set for a 15% rally after the sharp 7% price increase seen on Monday, technical indicators and on-chain metrics show. The recent price action of the so-called “Ethereum-killer” has formed a double-bottom technical formation and broke above the key $0.47 resistance, a bullish sign that is also supported by increasing network activity.
Also read: Cardano Price Forecast: ADA sets the stage for a 20% rally
Cardano price looks set to rebound
Cardano price, in the four-hour time frame, broke the resistance level of $0.47 on Monday and has held above it. From May 10 to 15, the Relative Strength Index (RSI) posted a bullish divergence with price, or when the RSI shows higher lows and prices form lower lows. This would point to increasing bullish momentum, and a move above the oversold area could work as the catalyst for a fresh long position.
In the first half of May, Cardano price created a peak at $0.47 after bouncing off the $0.42 support level twice. This ‘W’-like structure (double-bottom pattern) is a bottom reversal pattern and often hints at a potential trend reversal, favoring the bulls. If bullish momentum persists and ADA is able to break the resistance at $0.52 – a daily high from April 22 and the monthly pivot level of April – it is likely to rally 15% to $0.60, the high from April 11.
In the event of a decline, the Volume Profile indicator shows that the range between $0.47 and $0.45 is a good support zone. This area harbors the highest traded volume level, making it a good place for investors to buy the dip. To add more credence to this area, the 61.8% Fibonacci retracement level at $0.45 also roughly coincides with this area, making it a high probability reversal zone.
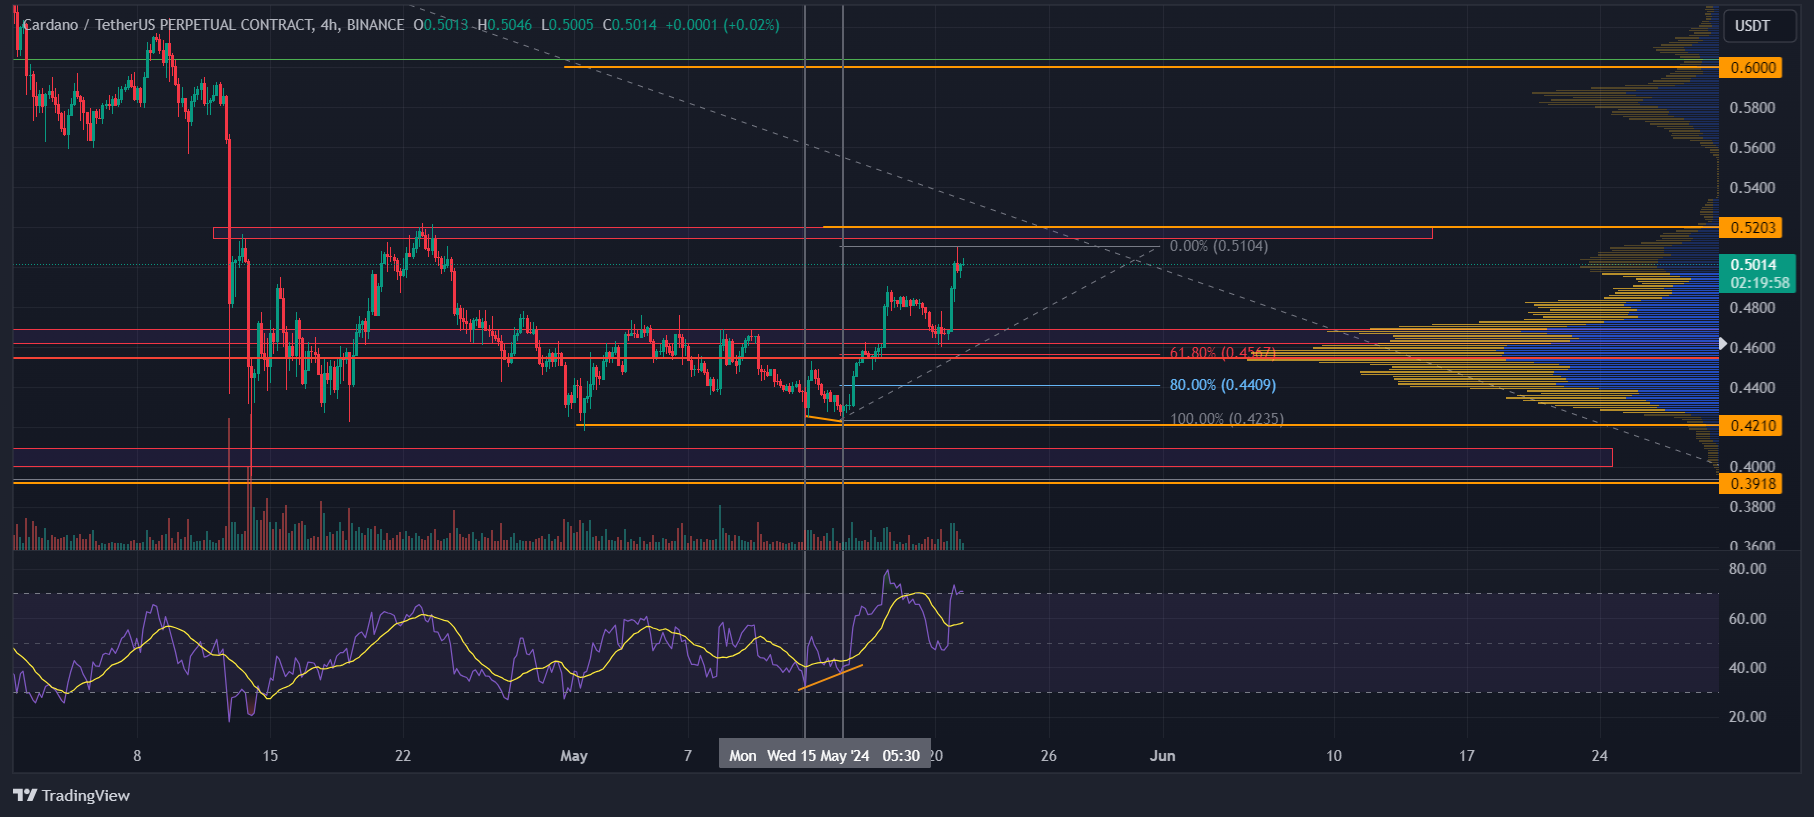
ADA/USDT 4-hour chart
Cardano’s on-chain metrics add to the bullish thesis. Data from IntoTheBlock shows a sharp increase in active addresses to 38,620 on May 20 from 21,640 on May 12. This suggests that the demand for Cardano is growing.
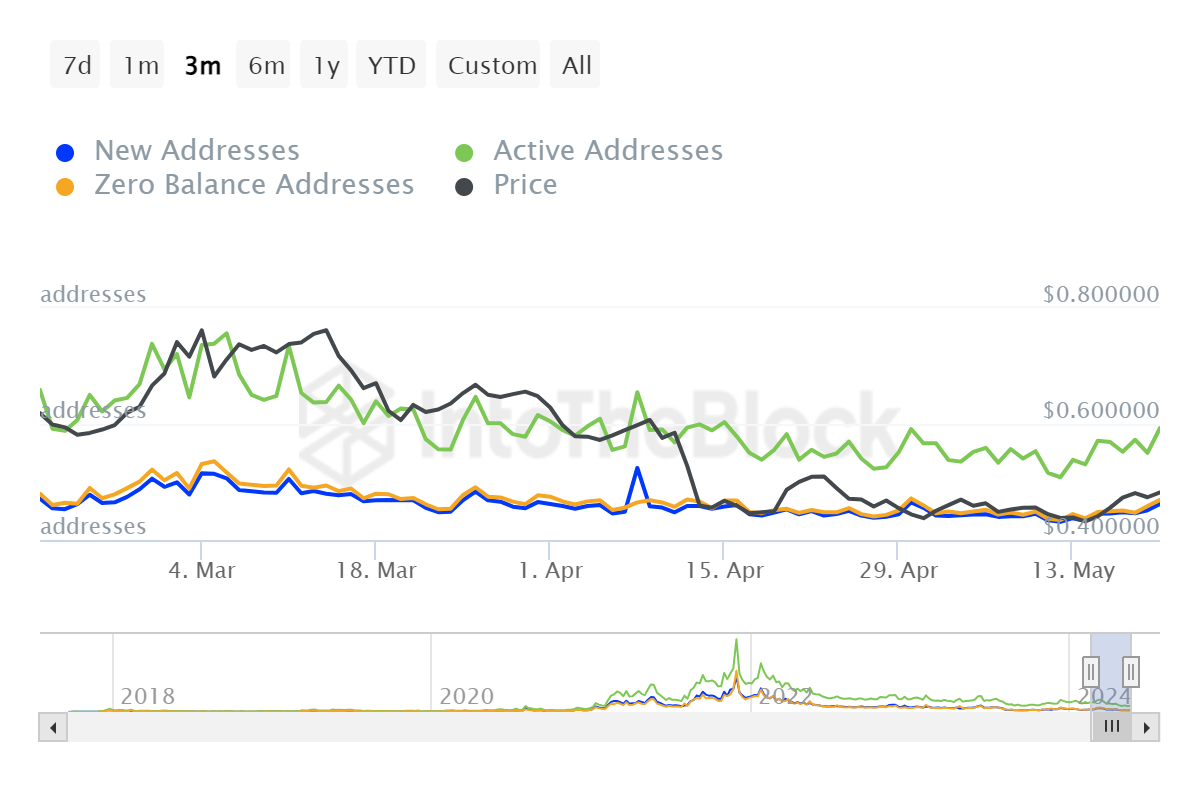
ADA Daily Active Addresses
The number of transactions by large-wallet investors, or those exceeding $100,000, can also give clues over future price action. Looking at Cardano, there has been a spike in transactions, showing that whales are gathering ADA tokens.
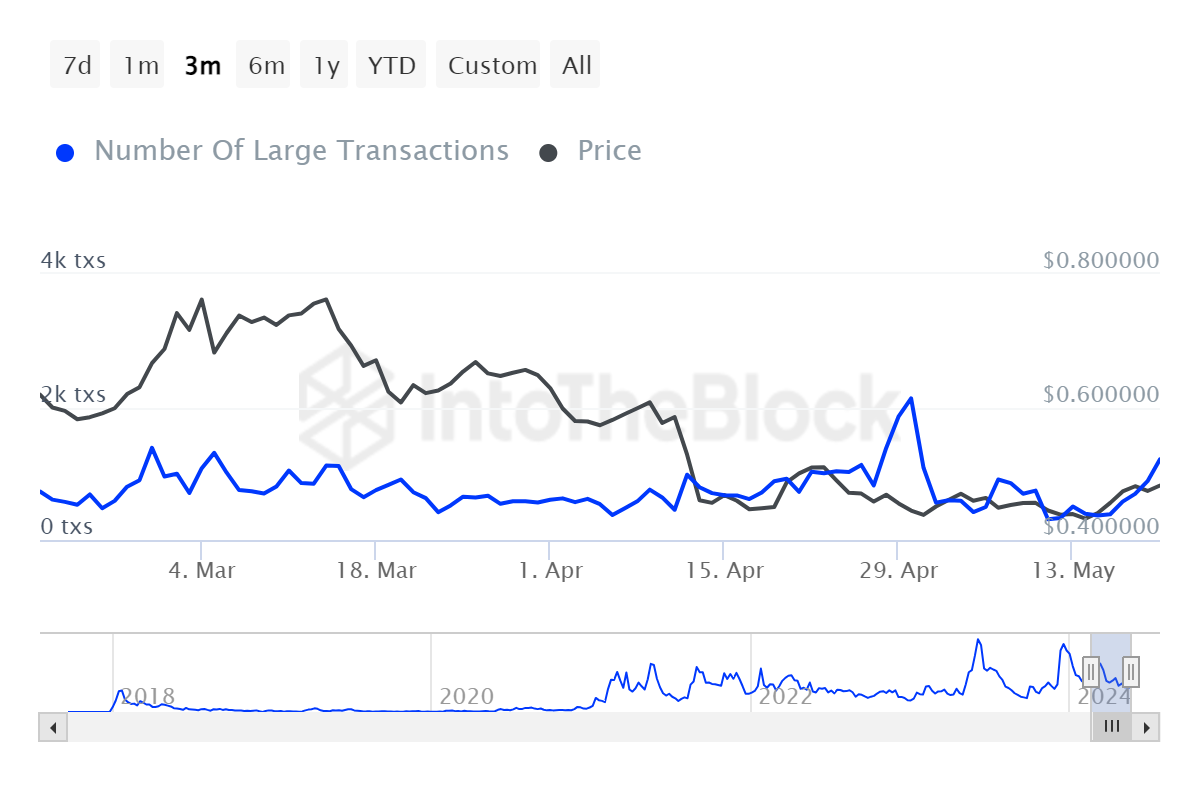
ADA Number of Large Transactions
The Large Holders Netflow gives investors and whales holding more than 0.1% of the supply a sense of how their positions are changing. To put it briefly, netflow dips indicate lower positions or selling, while spikes indicate accumulation from major players. As seen in the chart below, the spikes in Netflow indicate the whales' accumulation.
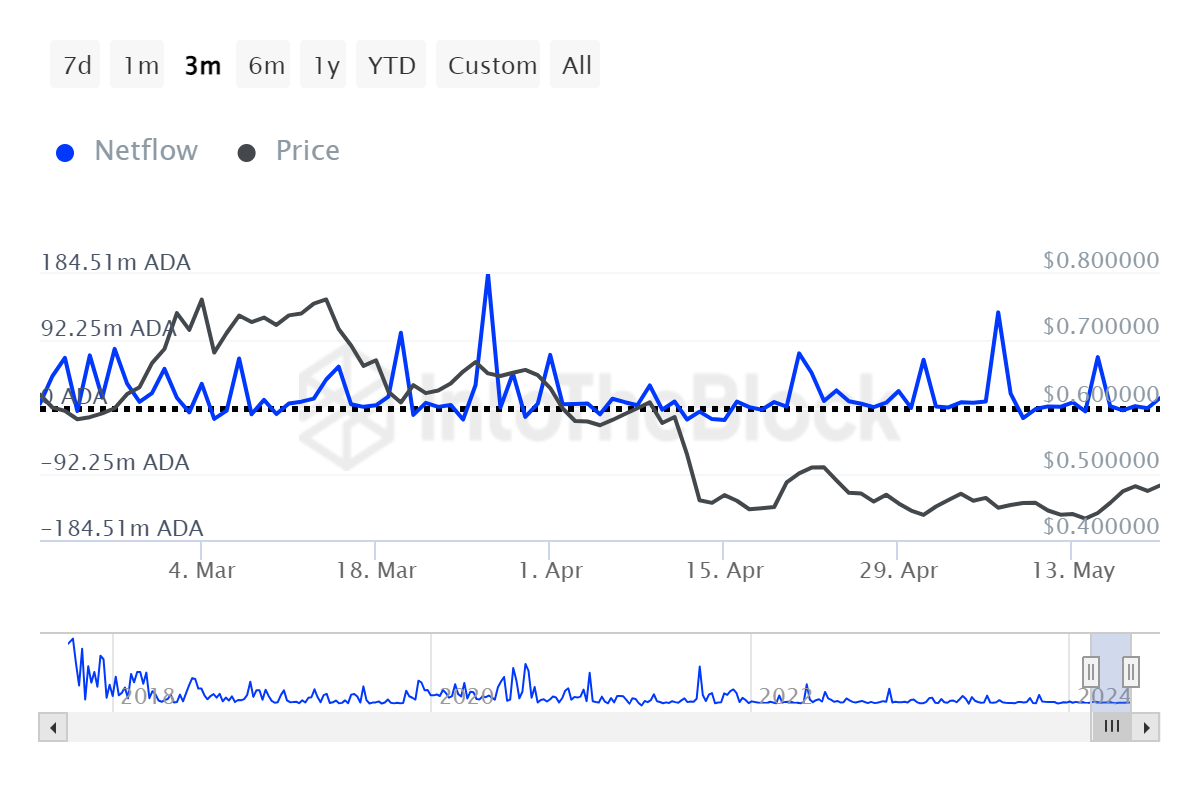
Large Holders Netflow
Despite strong on-chain data and technical analysis of Cardano, if the price could not break the resistance level of $0.52 and the overall crypto market is bearish, the prices of ADA could fall.
If Cardano's daily candlestick closes below $0.42, the price will form a lower low relative to the May 15 swing low, resuming the downtrend for Cardano and probably causing investors to sell their holdings out of fear. This will refute the bullish argument, leading to a 7% crash to the next key support level at $0.39, which acted as a strong barrier in mid-April and mid-November 2023.
Also read: Week Ahead: Ethereum and DeFi to come under spotlight this week
Author

Manish Chhetri
FXStreet
Manish Chhetri is a crypto specialist with over four years of experience in the cryptocurrency industry.




