Ondo price poised to break ATH of $1.04
- Ondo price is slowly testing its major support level at $0.63-$0.61.
- Aggressive buyers can consider accumulating around the immediate support zone, which extends from $0.83 to $0.80.
- If the daily candlestick closes below the $0.61 level, the bullish thesis will be invalidated.

The Ondo (ONDO) price has tried to break its recent all-time high but has failed to do so, and now prices are approaching major support levels.
Ondo price likely to provide accumulation opportunity
Ondo price attempted to breach its all-time high (ATH) at $1.04 but failed, leading to a correction. Confluence from the volume profile indicator suggests that the $0.83 to $0.80 range will likely serve as a support zone.
However, the optimal range to accumulate ONDO price would be between $0.630 to $0.618.
If Ondo price breaches the current ATH, investors can expect a 16% rally to $1.21.
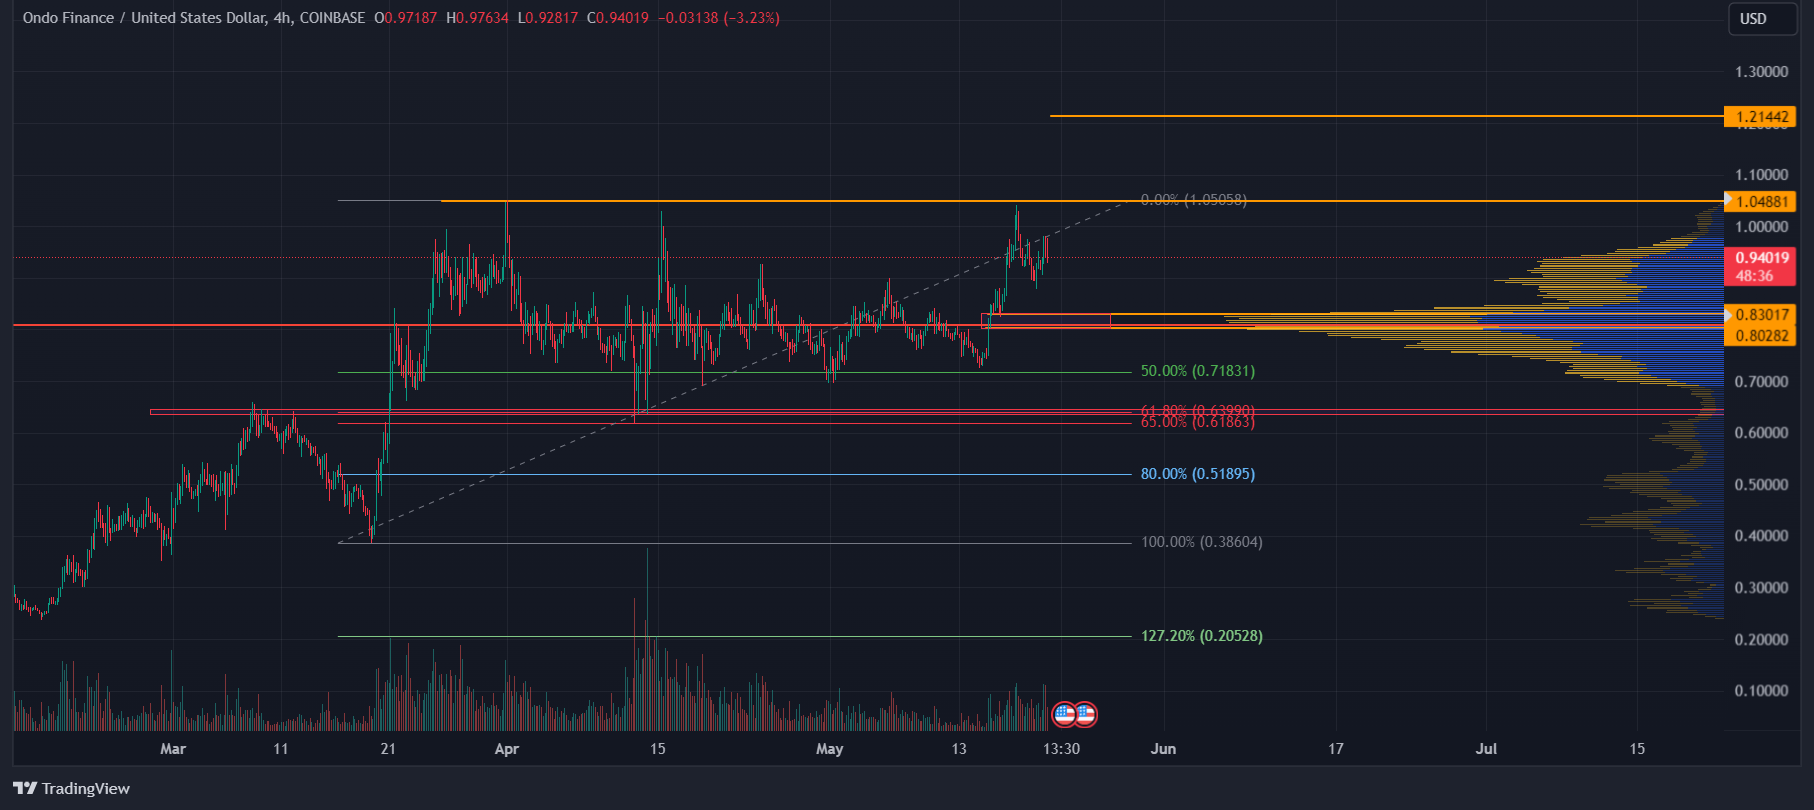
ONDO/USD 4-hour chart
The Total Value Locked (TVL) for all yield-bearing products offered by Ondo Finance has exceeded $435M, positioning Ondo Finance as the leading provider of tokenized US Treasuries.
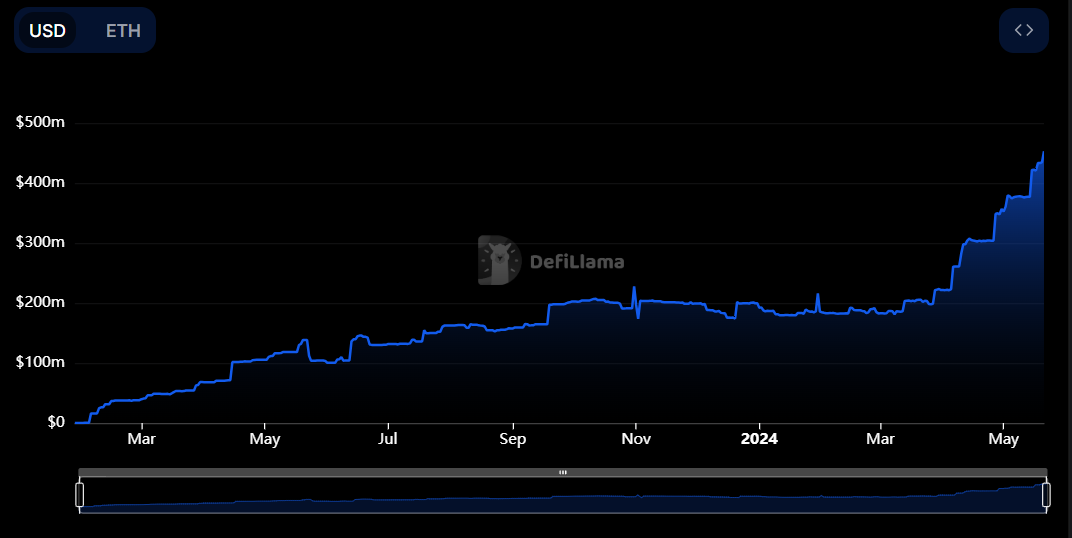
ONDO TVL chart
Based on IntoTheBlock's In/Out of the Money Map (IOMAP), nearly 6,400 addresses accumulated 656 million ONDO tokens. These addresses bought the RWA token between $0.82 and $0.88, which makes it a key support zone. These investors will likely add more to their holdings if the price retraces.
Interestingly, the $0.83 to $0.80 zone mentioned from a technical analysis perspective coincides with the IOMAP findings, making this zone a key reversal zone to watch.
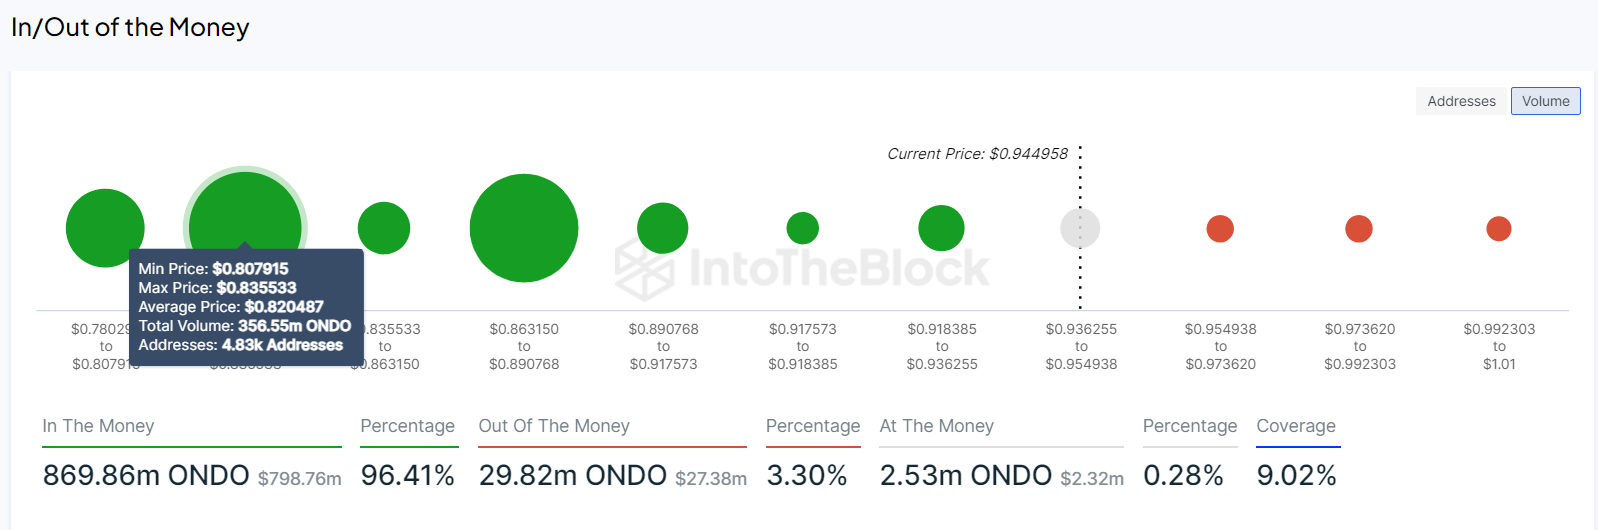
ONDO IOMAP
According to the Santiment’s Market Value to Realized Value (MVRV) Z score indicator, ONDO is undervalued. The MVRV Z score is an on-chain metric used to assess the underlying asset's fair value and it does so by measuring the deviation between the coin’s market and realized value. The Z score displays deviations from the asset's typical MVRV. It aids in determining when an asset's valuation is abnormally high or low.
As seen in the above graph, the Z score is currently at 0.644, which is a low score compared to the recent high of 3.6. This suggests that the asset is undervalued and has the potential to rise in price.
%20[20.28.32,%2020%20May,%202024]-638518672824507831.png)
ONDO MVRV Z score
Despite strong onchain data, Ondo's price has failed to overcome the ATH of $1.04 and rally. But if the crypto market outlook turns bearish, pushing ONDO lower could lead to complications.
If the Ondo price produces a daily candlestick close below $0.61, it would breach a key horizontal support level and create a lower low. This development would cause the market structure to flip bearish and likely attract panicking investors to sell their holdings, invalidating the bullish thesis.
If ONDO sees a sustained breach below $0.61, a 38% crash would be imminent, knocking the Real World Asset (RWA) down to the next key support level at $0.39.
Author

Manish Chhetri
FXStreet
Manish Chhetri is a crypto specialist with over four years of experience in the cryptocurrency industry.




