- Polkadot retreats from record highs at $30 amid widespread crypto declines.
- Support at the 50 SMA and the ascending channel’s middle boundary must hold to avert losses eyeing $20.
- Recovery to $30 will resume if the immediate support at $25 remains intact.
Polkadot has recently hit a new milestone at $30. The rally has been steady and consistent, especially in February. An ascending parallel channel also came into the picture, which helped control DOT’s downward price actions.
Polkadot has retreated from the all-time highs at the time of writing and is exchanging hands at $25. If the immediate crucial support fails to hold, the price will tumble toward $20.
Polkadot depends on crucial support to avert potential losses
The ascending parallel channel lower boundary in conjunction with the 50 Simple Moving Average (SMA) on the 4-hour chart provides Polkadot with immediate support. Failing to hold above this critical support will be a massive bearish signal.
On the downside, the next tentative support is the 100 SMA, near $20. If push comes to shove, the 200 SMA will come in handy to stop declines from extending below $20.
The Moving Average Convergence Divergence (MACD) adds weight to the bearish outlook. When used properly, the MACD strategy can help traders identify positions to sell the top and buy the bottom. The MACD line (blue) crossed under the signal line, suggesting that it was time to sell the top. For now, the least resistance path is downwards until formidable support is established.
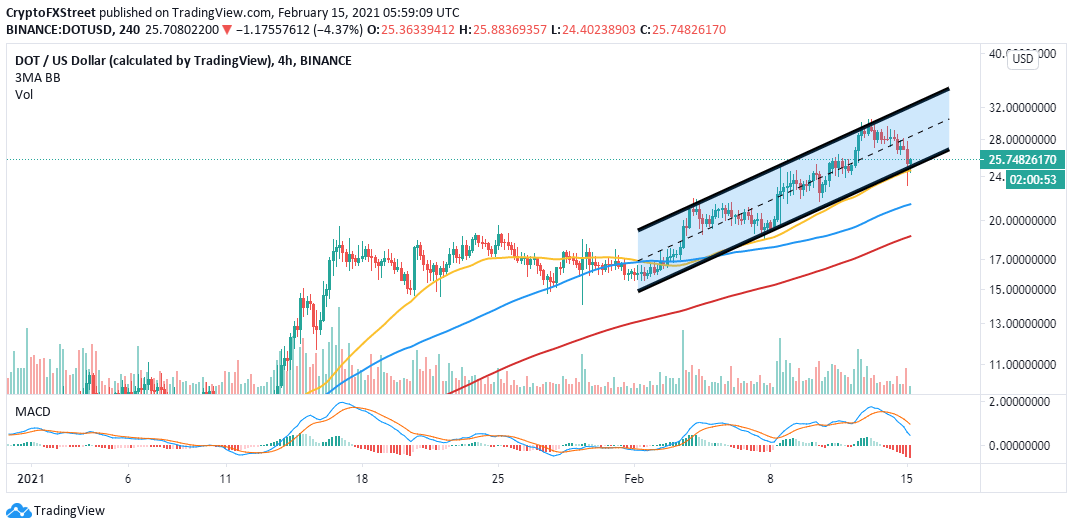
DOT/USD 4-hour chart
Santiment, a leading behavioral analytics platform, shows that Polkadot attracts massive social media volume on its run-up to $30. The social volume model tracks the number of mentions of a coin on more than 1,000 crypto social media channels such as crypto subreddits, discord groups, and Telegram groups.
A sudden spike in the volume is not a bullish signal. Often investor sentiment flips bearish, and selling pressure begins to mount. Therefore, Polkadot’s retracement seems to have been validated and could continue if bulls fail to secure higher support.
Polkadot volume chart
Looking at the other side of the fence
Polkadot will avert the looming losses to $20 if the buyer congestion at the 50 SMA on the 4-hour is dispersed. This region is reinforced by the ascending channel’s lower boundary, suggesting that support could remain intact. A rebound from this support will pave the way for gains back to $30.
Information on these pages contains forward-looking statements that involve risks and uncertainties. Markets and instruments profiled on this page are for informational purposes only and should not in any way come across as a recommendation to buy or sell in these assets. You should do your own thorough research before making any investment decisions. FXStreet does not in any way guarantee that this information is free from mistakes, errors, or material misstatements. It also does not guarantee that this information is of a timely nature. Investing in Open Markets involves a great deal of risk, including the loss of all or a portion of your investment, as well as emotional distress. All risks, losses and costs associated with investing, including total loss of principal, are your responsibility. The views and opinions expressed in this article are those of the authors and do not necessarily reflect the official policy or position of FXStreet nor its advertisers. The author will not be held responsible for information that is found at the end of links posted on this page.
If not otherwise explicitly mentioned in the body of the article, at the time of writing, the author has no position in any stock mentioned in this article and no business relationship with any company mentioned. The author has not received compensation for writing this article, other than from FXStreet.
FXStreet and the author do not provide personalized recommendations. The author makes no representations as to the accuracy, completeness, or suitability of this information. FXStreet and the author will not be liable for any errors, omissions or any losses, injuries or damages arising from this information and its display or use. Errors and omissions excepted.
The author and FXStreet are not registered investment advisors and nothing in this article is intended to be investment advice.
Recommended Content
Editors’ Picks

Ripple Price Prediction: Whale accumulation sparks hope as rising exchange reserves signal caution
XRP sustains mid-week recovery as XRP/BTC flashes golden cross for the first time since 2017. Large volume holders increase XRP exposure, indicating rising demand and investor confidence.

Pi Network Price Forecast: PI eyes $0.66 as whale activity surges
Pi Network (PI) declines by nearly 4% on Friday, trading at $0.79 at press time. The technical outlook suggests a downward move ahead as the short-term recovery concludes with a trendline breakdown.

Bitcoin Weekly Forecast: BTC enters full price-discovery mode after seven straight weeks of gains
Bitcoin price stabilizes around $111,000 on Friday after reaching a new all-time high of $111,900 this week. Corporate accumulation, institutional demand, signs of easing regulations and fiscal woes in the US have fueled BTC’s rally.

Jupiter Price Forecast: JUP eyes $0.82 as Fluid backs Jupiter's upcoming lending protocol
Jupiter exchanges announced the upcoming launch of Jupiter Lend, powered by Fluid, on Solana this summer. With the announcement of Jupiter Lend, the JUP token surged 16% in the last 24 hours.

Bitcoin: BTC enters full price-discovery mode after seven straight weeks of gains
Bitcoin (BTC) price stabilizes near $111,000 on Friday after reaching a new all-time high of $111,900 this week. BTC enters an uncharted territory as a perfect storm of corporate accumulation, institutional demand, signs of easing regulation and increasing concerns among investors about debt sustainability in the United States (US) have fueled bullish momentum.