Polkadot Price Forecast: DOT at risk of a drop towards $22 after significant rejection
- Polkadot has been trading inside a broadening wedge pattern for the past 48 hours.
- The digital asset had a fakeout and is now at risk of falling towards $22.
- A crucial indicator is on the verge of presenting various sell signals for Polkadot.

Polkadot defended a key support level on February 10 and bounced significantly towards a new all-time high at $25.7. However, the breakout above the previous high was notably weak and the digital asset saw a quick pullback down to $24.5.
Polkadot price shows signs of an upcoming correction
On the 1-hour chart, Polkadot established a broadening wedge pattern and several hours ago, bulls attempted a breakout above the upper resistance trendline. Unfortunately, it had no continuation and transformed into a fakeout as the digital asset quickly dropped below the trendline again.
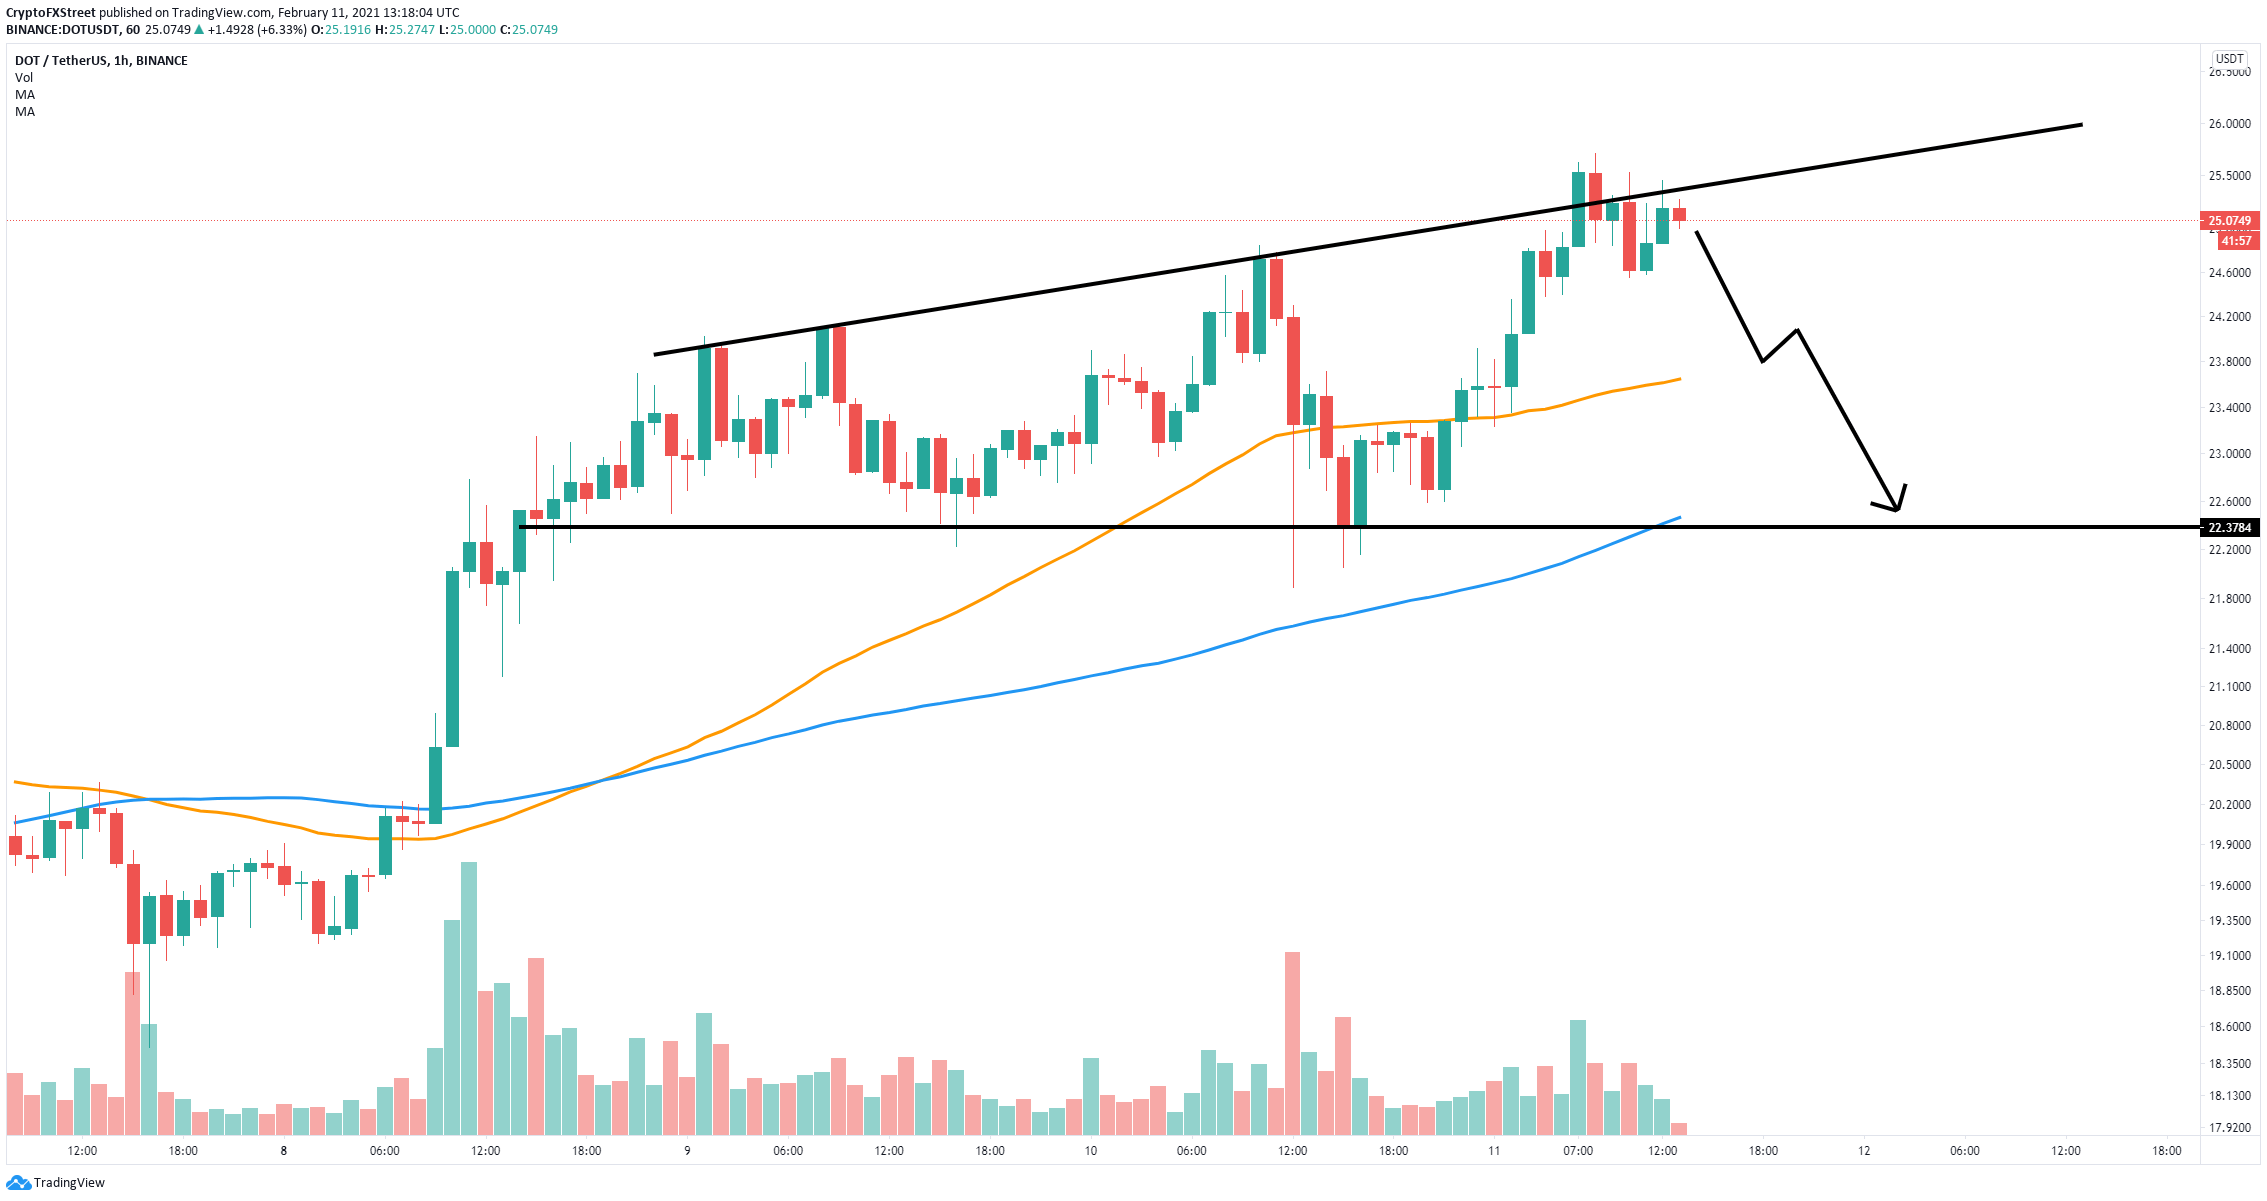
DOT/USD 1-hour chart
The nearest support level is located at $23.7 which is the 50-SMA, if this level also breaks, Polkadot price can fall towards the lower trendline support of the pattern located at $22.3 which coincides with the 100-SMA.
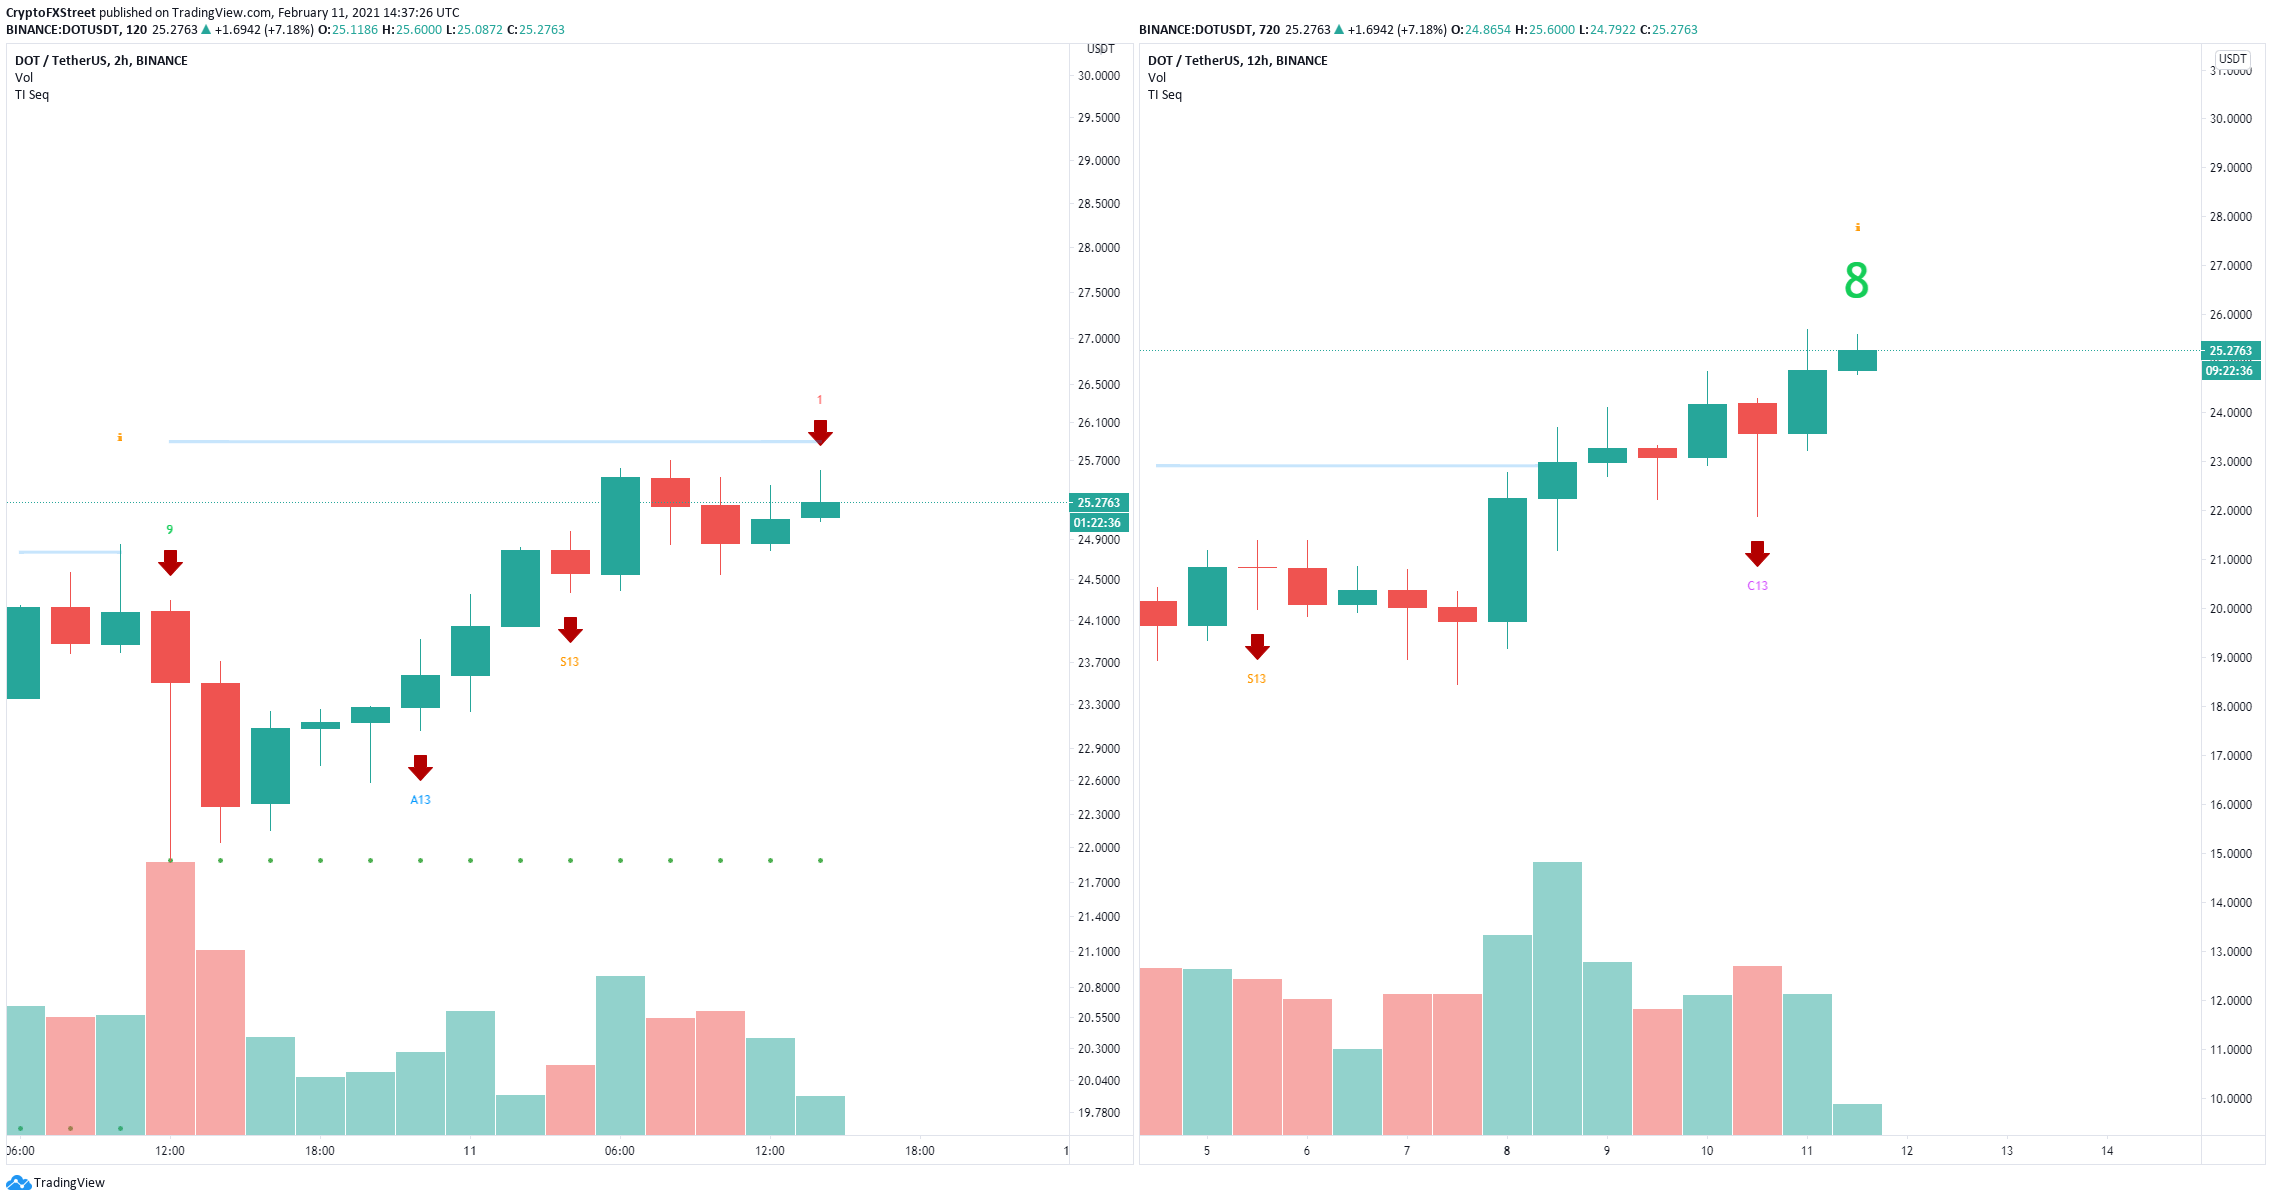
DOT Sell Signals
Additionally, the TD Sequential indicator presented a sell signal on the 2-hour chart and a green ‘8’ candlestick on the 12-hour chart which can easily transform into another sell signal, adding even more credence to the bearish outlook.
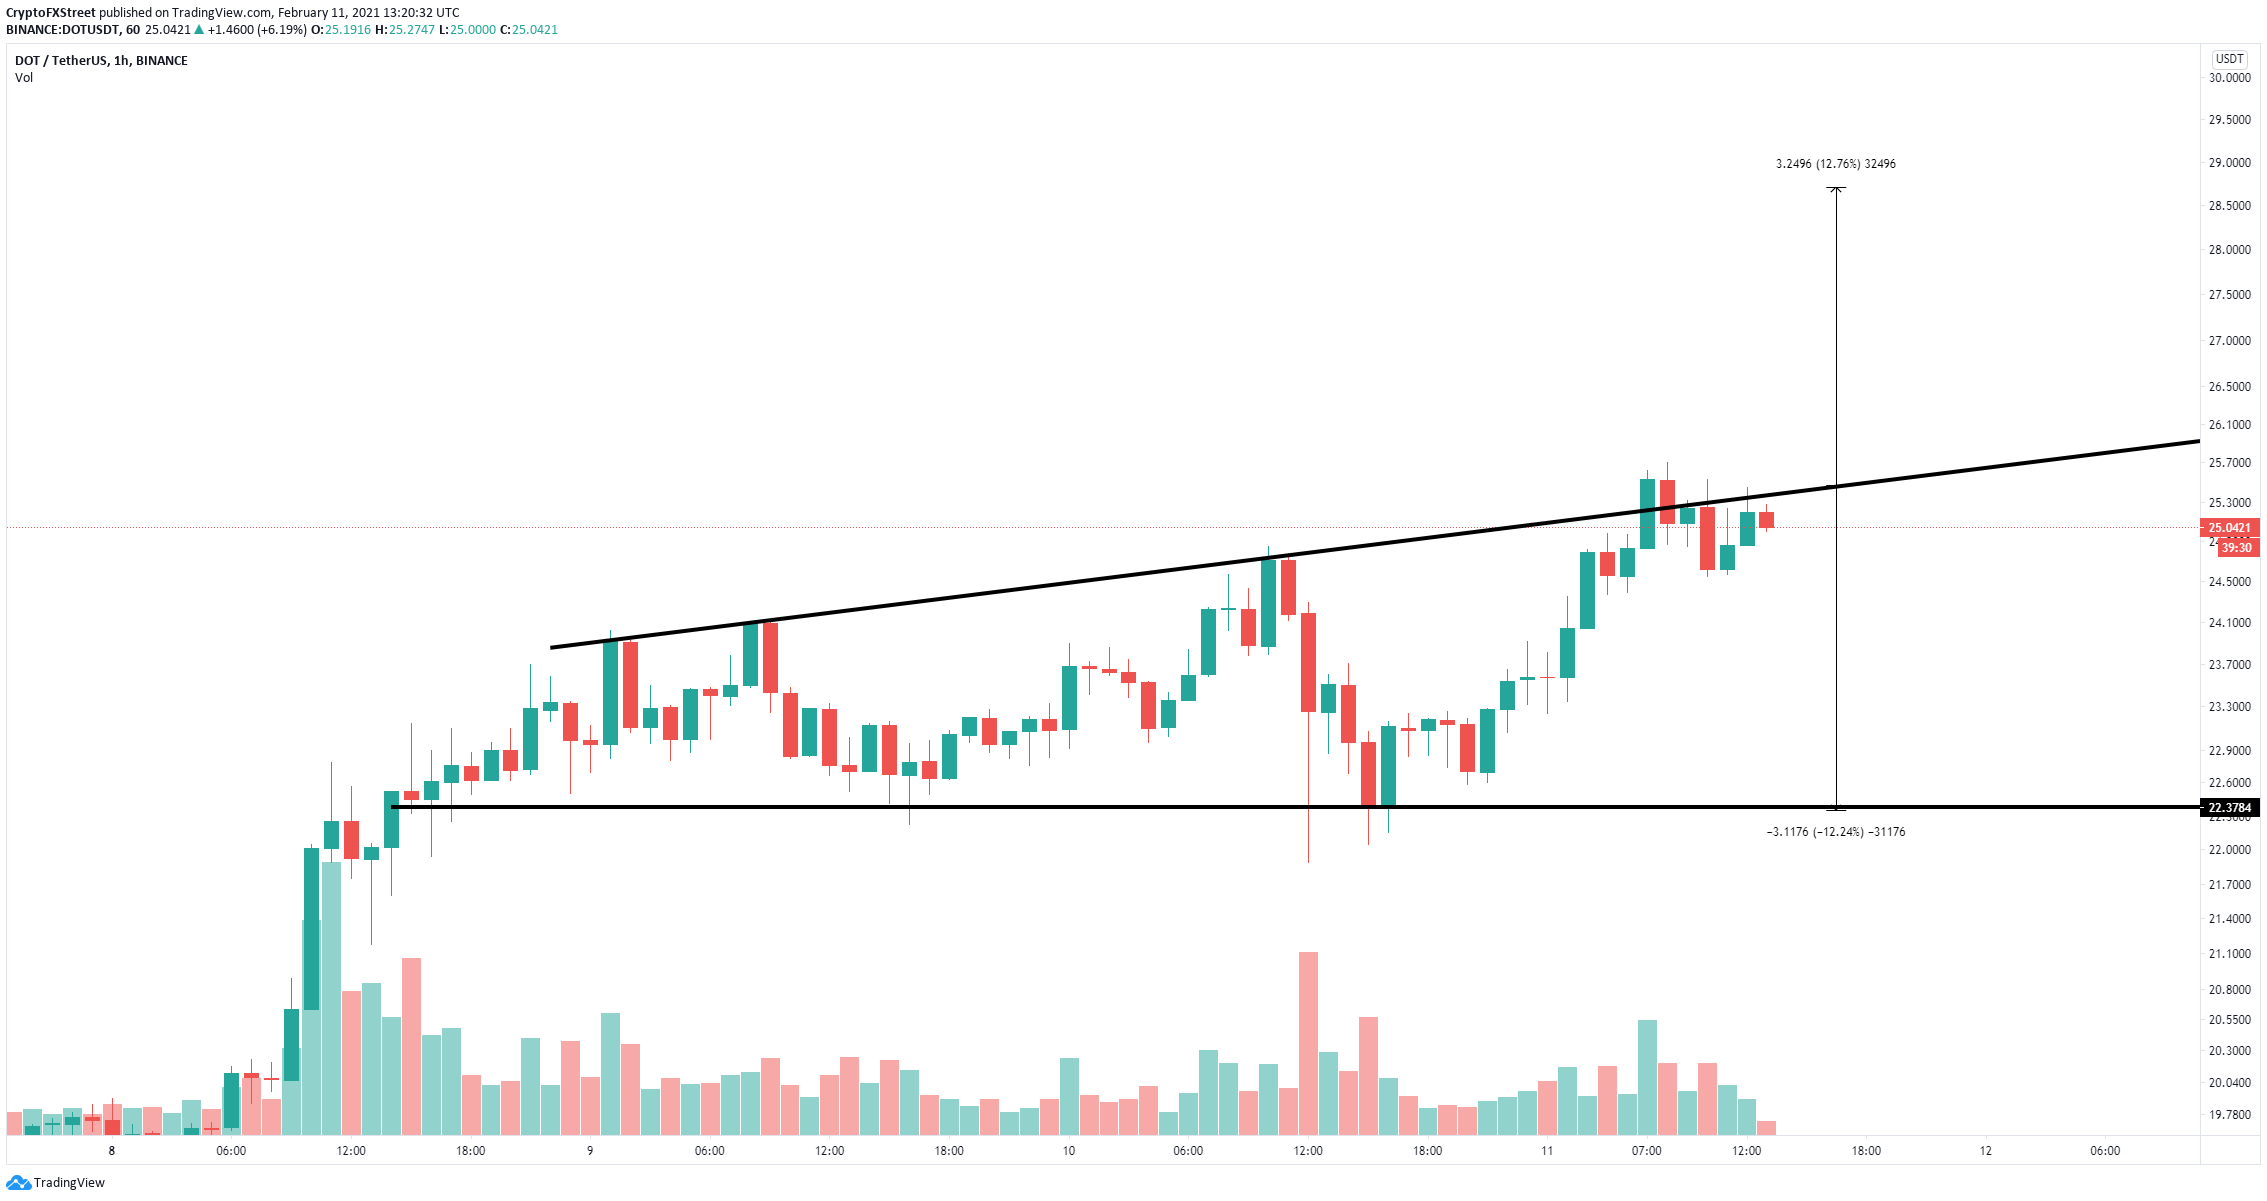
DOT/USD 1-hour chart
However, Polkadot price is still close to the upper trendline resistance at $25.4. Another breakout above this point would have a 12% price target up to $28.7 if there is enough bullish continuation.
Author

Lorenzo Stroe
Independent Analyst
Lorenzo is an experienced Technical Analyst and Content Writer who has been working in the cryptocurrency industry since 2012. He also has a passion for trading.


