• Polkadot price is vulnerable after breaking below a critical support trend line; open to a 19% decline
  • The layer-1 token is looking to test the reliability of key support levels before recovery can be expected.
  • DOT must hold above $32 to prevent further losses. 

Polkadot price action has been muted, as DOT has failed to galvanize investors’ enthusiasm. The layer-1 token continues to slide lower, recording lower lows and lower highs. The governing technical pattern suggests that the token is likely to tag $27 if a key support level fails to hold.

Polkadot price to test reliability of support

Polkadot price has sliced below the lower boundary of an ascending parallel channel on the daily chart, suggesting a bearish forecast ahead for the token. DOT could continue to slide lower as investors engage in a period of profit-taking. 

The first line of defense for Polkadot price is at the 50% retracement level at $32.74, then at the 200-day Simple Moving Average (SMA) at $28.81 which acts as a sturdy foothold as it coincides with the support line given by the Momentum Reversal Indicator (MRI).

However, if the aforementioned support fails to act as a reliable line of defense for Polkadot price, DOT could fall further to hit the bearish target projected by the governing technical pattern at $27.46, where the 61.8% Fibonacci retracement support also sits.

If selling pressure eases, the bulls could be incentivized to push Polkadot price higher toward the first resistance at the 100-day SMA at $37.11. An additional spike in buy orders could see DOT tag the 38.2% Fibonacci retracement resistance at $38.02.

To prevent further losses, buyers should target the lower boundary of the parallel channel pullback resistance at $40.58 next. However, additional hurdles for Polkadot price may emerge at the 21-day SMA at $42.10, then at the 50-day SMA at $43.68.

DOTUSDT

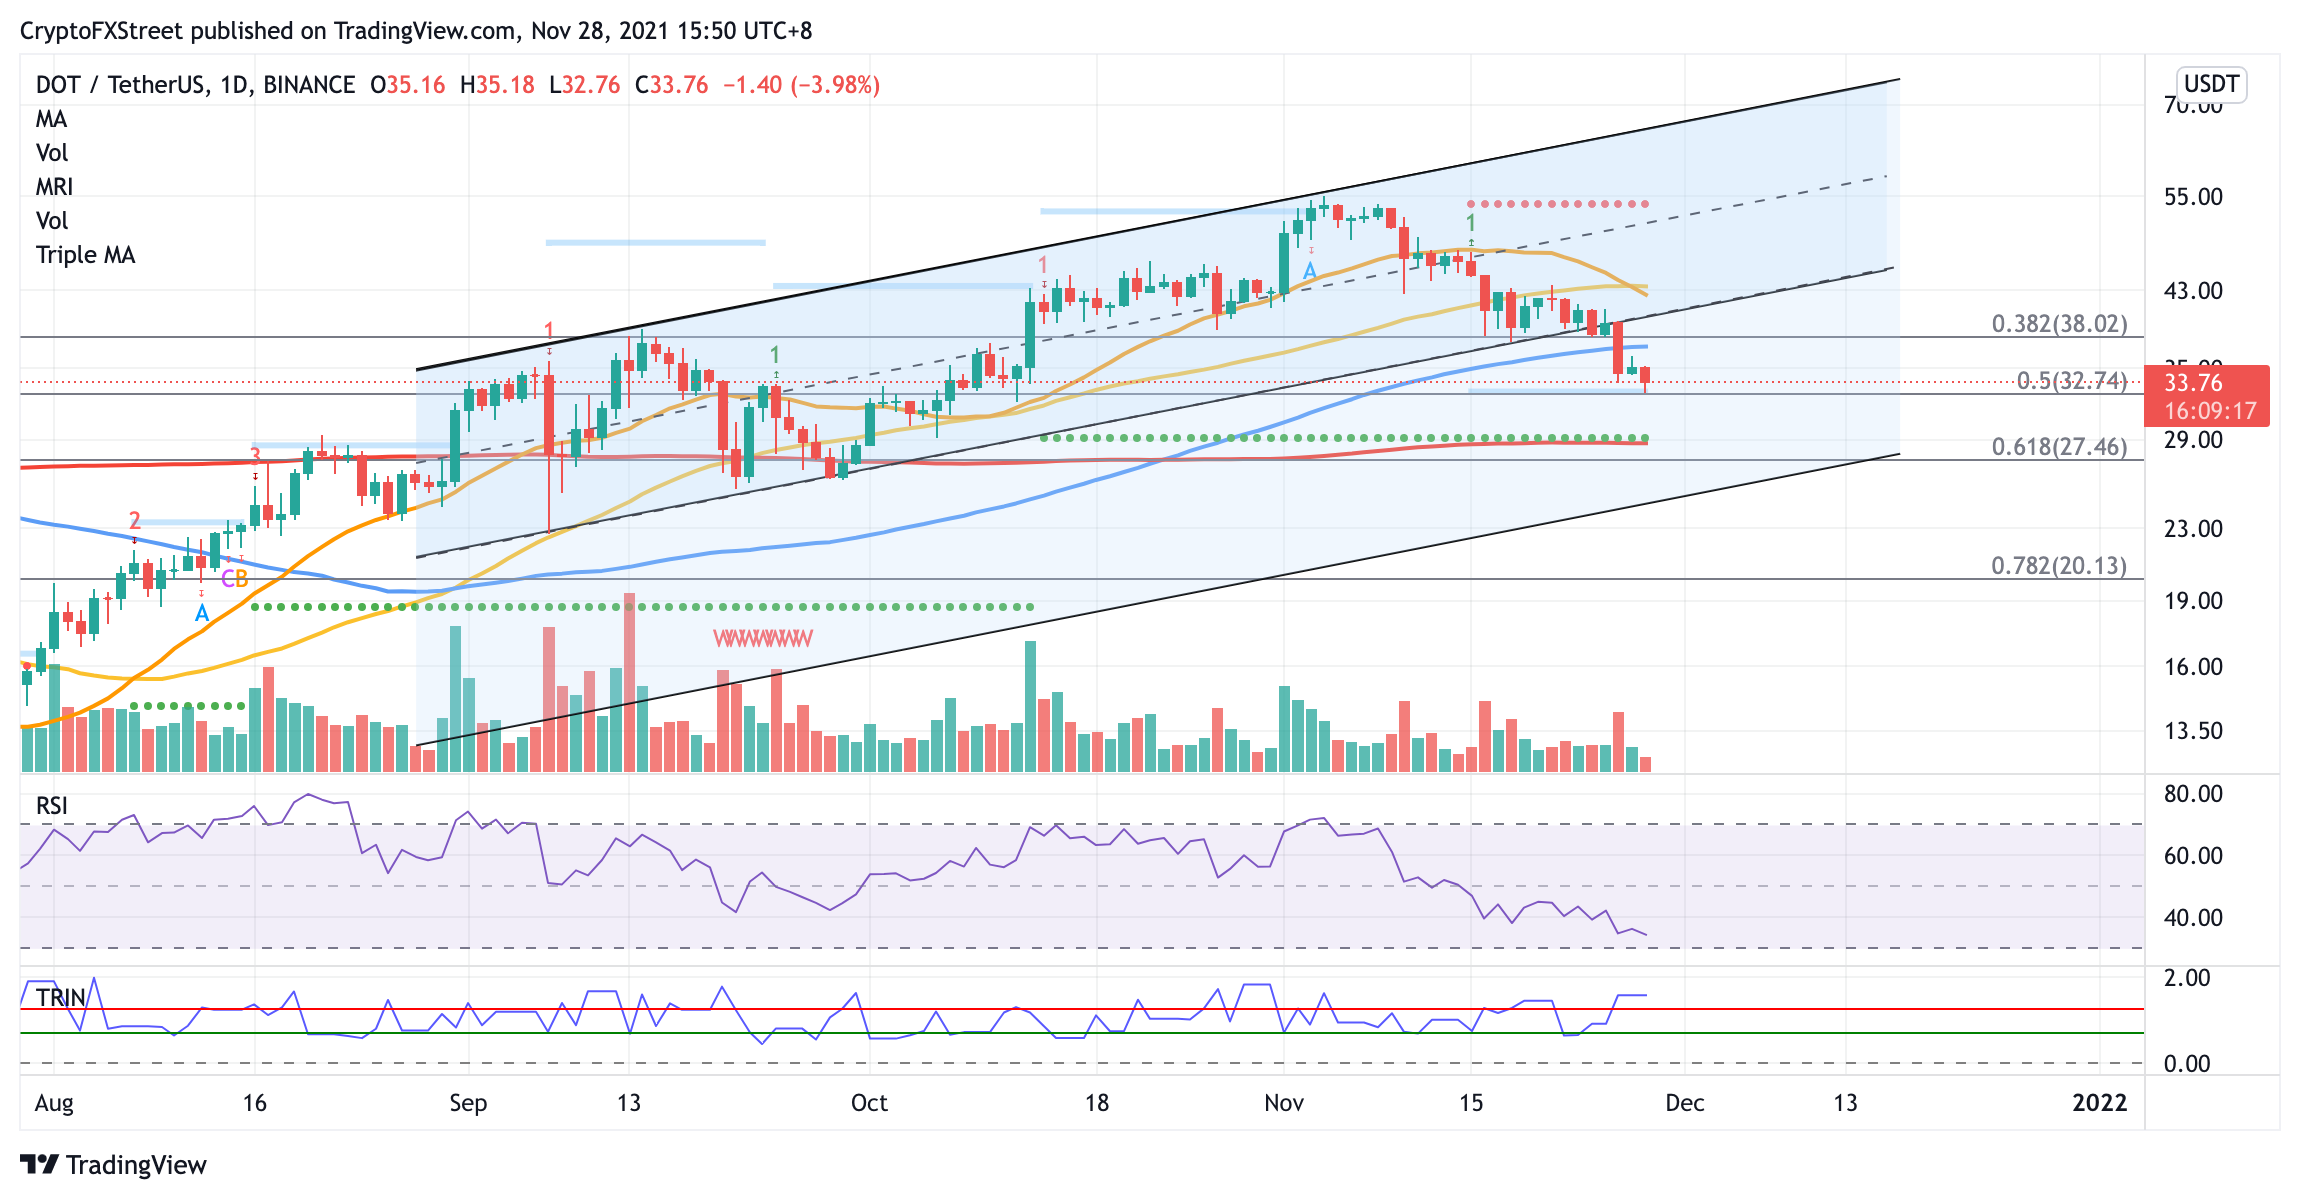
DOT/USDT daily chart

If the bulls manage to reverse the period of underperformance, slashing through the aforementioned obstacles, Polkadot price could aim for the middle boundary of the governing technical pattern at $54.20, located near the MRI’s resistance line and the token’s all-time high thereafter.


Note: All information on this page is subject to change. The use of this website constitutes acceptance of our user agreement. Please read our privacy policy and legal disclaimer. Opinions expressed at FXstreet.com are those of the individual authors and do not necessarily represent the opinion of FXstreet.com or its management. Risk Disclosure: Trading foreign exchange on margin carries a high level of risk, and may not be suitable for all investors. The high degree of leverage can work against you as well as for you. Before deciding to invest in foreign exchange you should carefully consider your investment objectives, level of experience, and risk appetite. The possibility exists that you could sustain a loss of some or all of your initial investment and therefore you should not invest money that you cannot afford to lose. You should be aware of all the risks associated with foreign exchange trading, and seek advice from an independent financial advisor if you have any doubts.

Recommended content


Recommended Content

Editors’ Picks

Bitcoin Weekly Forecast: Fed-led rally could have legs towards $65,000

Bitcoin Weekly Forecast: Fed-led rally could have legs towards $65,000

Bitcoin has risen 7% so far this week, supported by the US Fed interest-rate cut and more than $300 million in ETFs inflows. The recent surge led BTC price to shatter several key technical resistance levels, a sign that the current two-week rally has likely some more way to go towards $65,000.

More Bitcoin News
Ethereum, BNB and POL holders on the watch as BingX faces loss of $26 million in hack

Ethereum, BNB and POL holders on the watch as BingX faces loss of $26 million in hack

Crypto exchange BingX said on Friday that it suffered a hack, an attack that led to “minimal” losses that researchers at PeckShield estimate at $26.68 million.  The attacker swapped the stolen altcoins for Ethereum, Binance Coin and Polygon tokens, according to on-chain data. 

More Cryptocurrencies News
Pepe price forecast: Eyes for 30% rally

Pepe price forecast: Eyes for 30% rally

Pepe extends the upward movement on Friday after breaking above the descending trendline and resistance barrier on Thursday. PEPE’s dormant wallets are in motion, and the long-to-short ratio is above one, further supporting this bullish move and hinting at a rally on the horizon.

More PEPE News
Shiba Inu is poised for a rally as price action and on-chain metrics signal bullish momentum

Shiba Inu is poised for a rally as price action and on-chain metrics signal bullish momentum

Shiba Inu remains strong on Friday after breaking above a symmetrical triangle pattern on Thursday. This breakout signals bullish momentum, further bolstered by a rise in daily new transactions that suggests a potential rally in the coming days.

More Shiba Inu News
Bitcoin: On the road to $60,000

Bitcoin: On the road to $60,000

Bitcoin price retested and bounced off from the daily support level of $56,000 this week. US spot Bitcoin ETFs posted $140.7 million in inflows until Thursday and on-chain data supports a bullish outlook.

Read full analysis
Moneta Markets review 2024: All you need to know

Moneta Markets review 2024: All you need to know

VERIFIED In this review, the FXStreet team provides an independent and thorough analysis based on direct testing and real experiences with Moneta Markets – an excellent broker for novice to intermediate forex traders who want to broaden their knowledge base.

Read More

BTC

ETH

XRP