Polkadot presents a powerful buy opportunity before DOT breaks higher to $68
- Polkadot price action developing a powerful bullish Point and Figure pattern.
- Upon confirmation and entry, Polkadot could spike 51%.
- Downside pressure remains as an equally strong bearish pattern is also likely.

Polkadot price has two powerful Point and Figure patterns in development. As a result, strong movement in the direction of either entry is expected – but the trend favors the long side of the trade.
Polkadot price ready to spike over 50% to hit a new all-time high at $68
Polkadot price has two trade setups developing on its Point and Figure chart. The long idea is most likely to trigger out of the two patterns because the prior trend is bullish, and the overall pattern is a bull flag.
On the long side of the market, the hypothetical long entry is a buy stop order at $45, a stop loss at $41 and a profit target at $68. This entry is based on a triple-top breakout that simultaneously converts the chart from a bear market to a bull market.
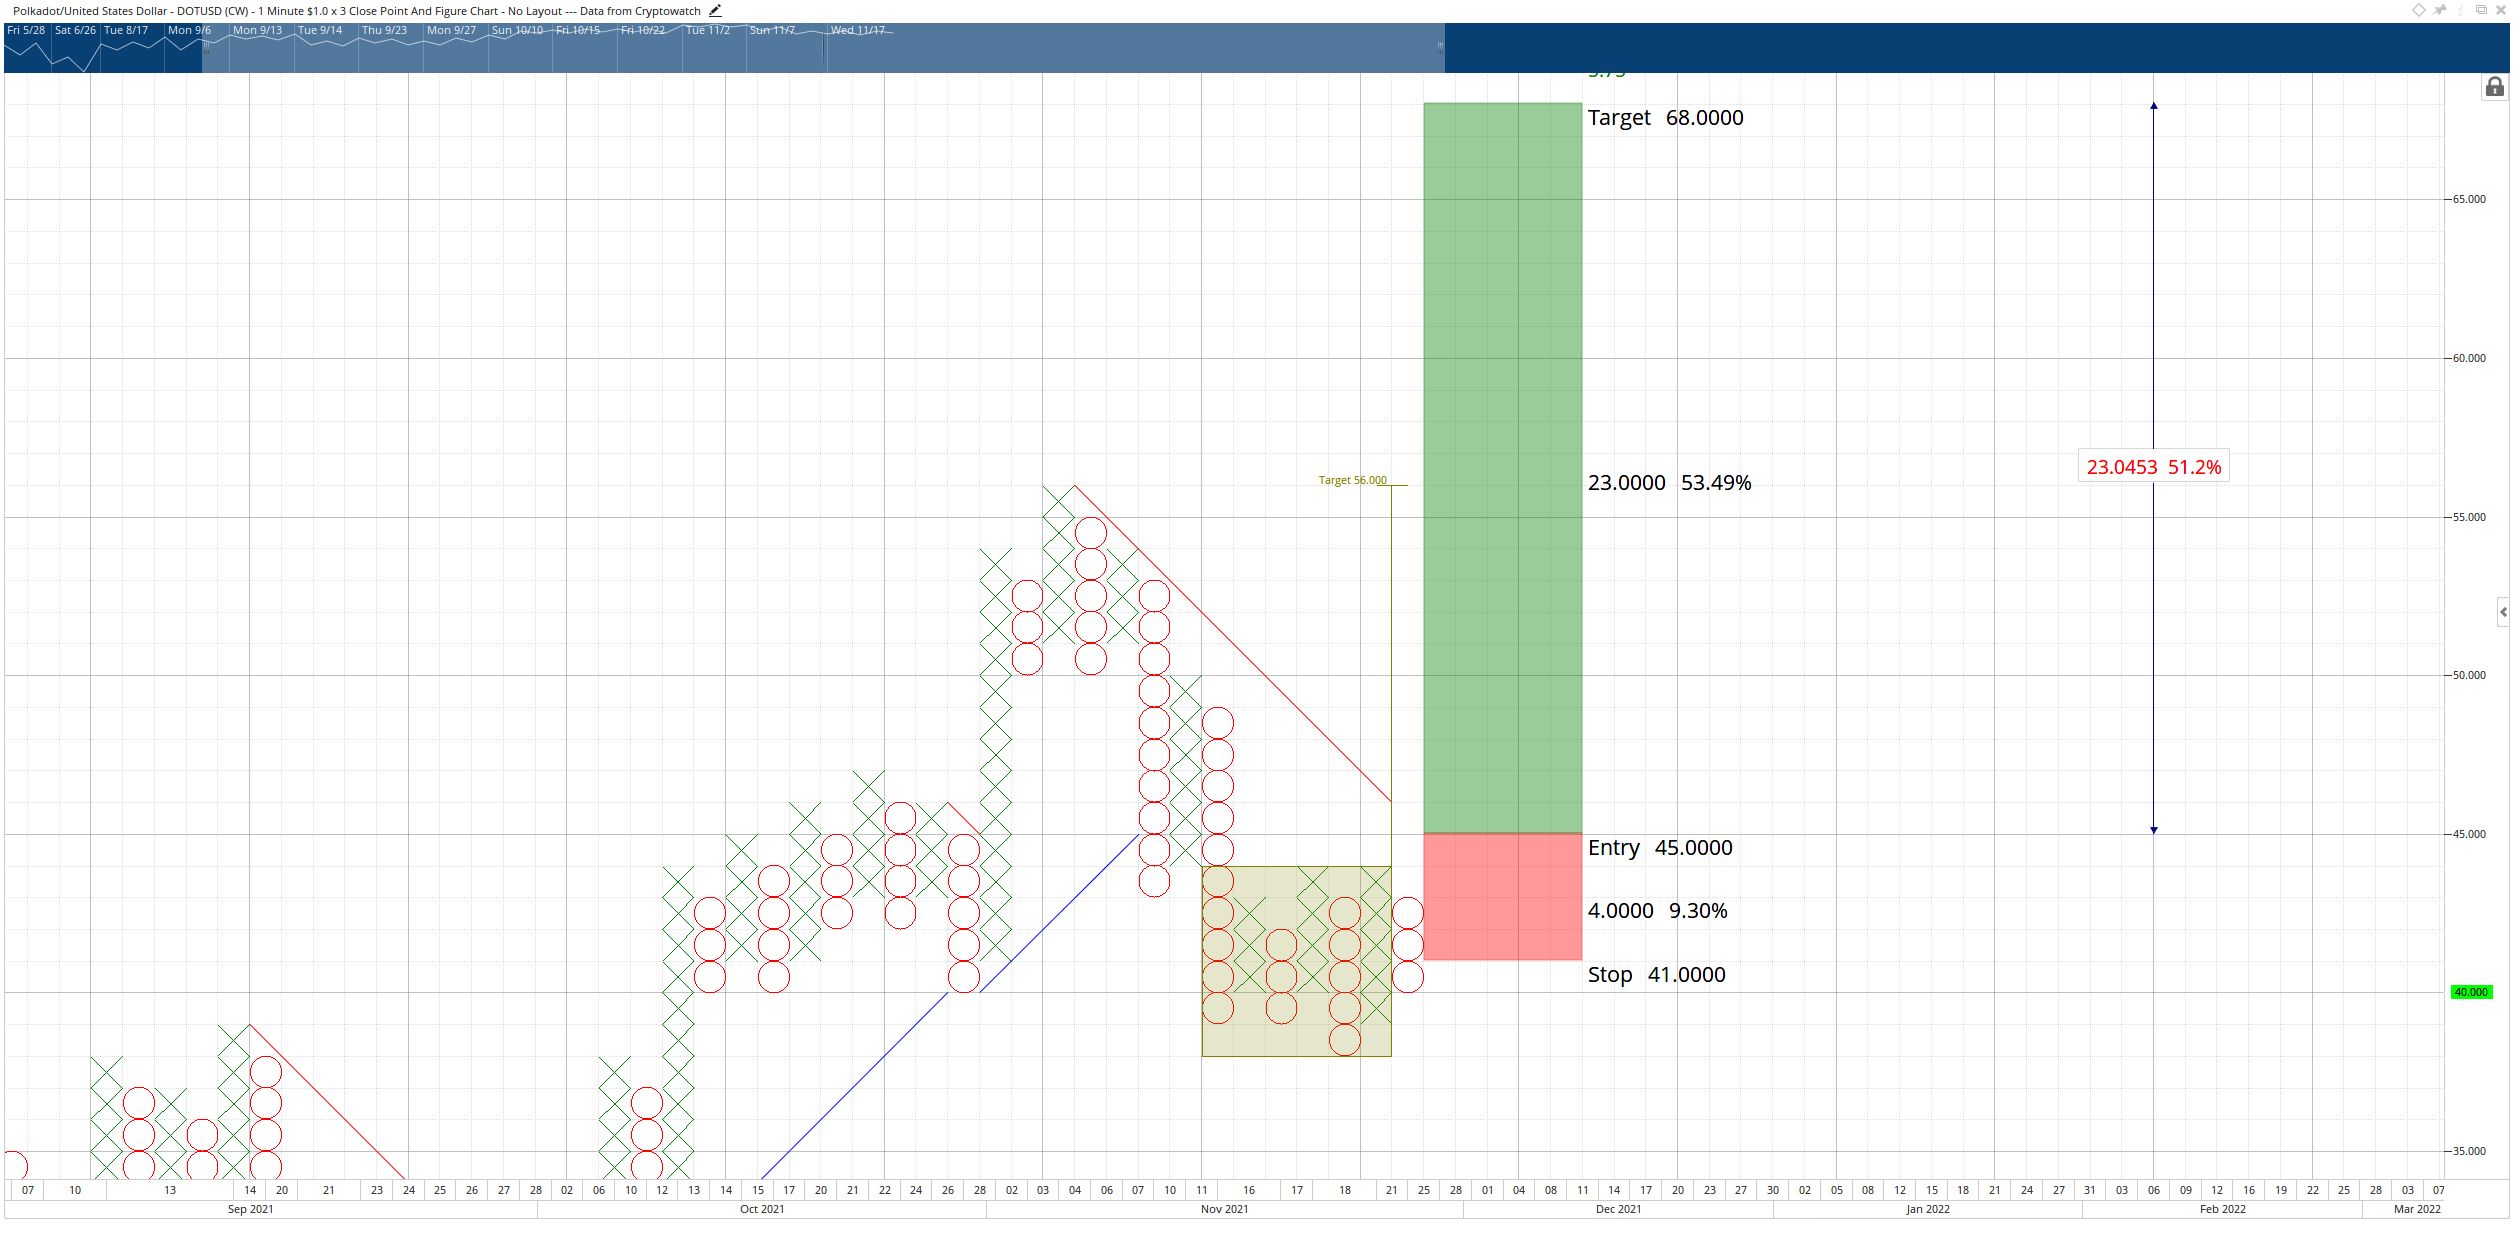
DOT/USDT $1.00/3-box Reversal Point and Figure Chart
This trade is invalidated if Polkadot price drops to $35 before the entry is triggered.
On the short side of the market, the theoretical entry for Polkadot price is a sell stop order at $37, a stop loss at $40 and a profit target at $28. This trade has a tighter stop loss of only three boxes because the prior trend was an uptrend. The short entry is based on a breakout below a Bearish Catapult pattern.
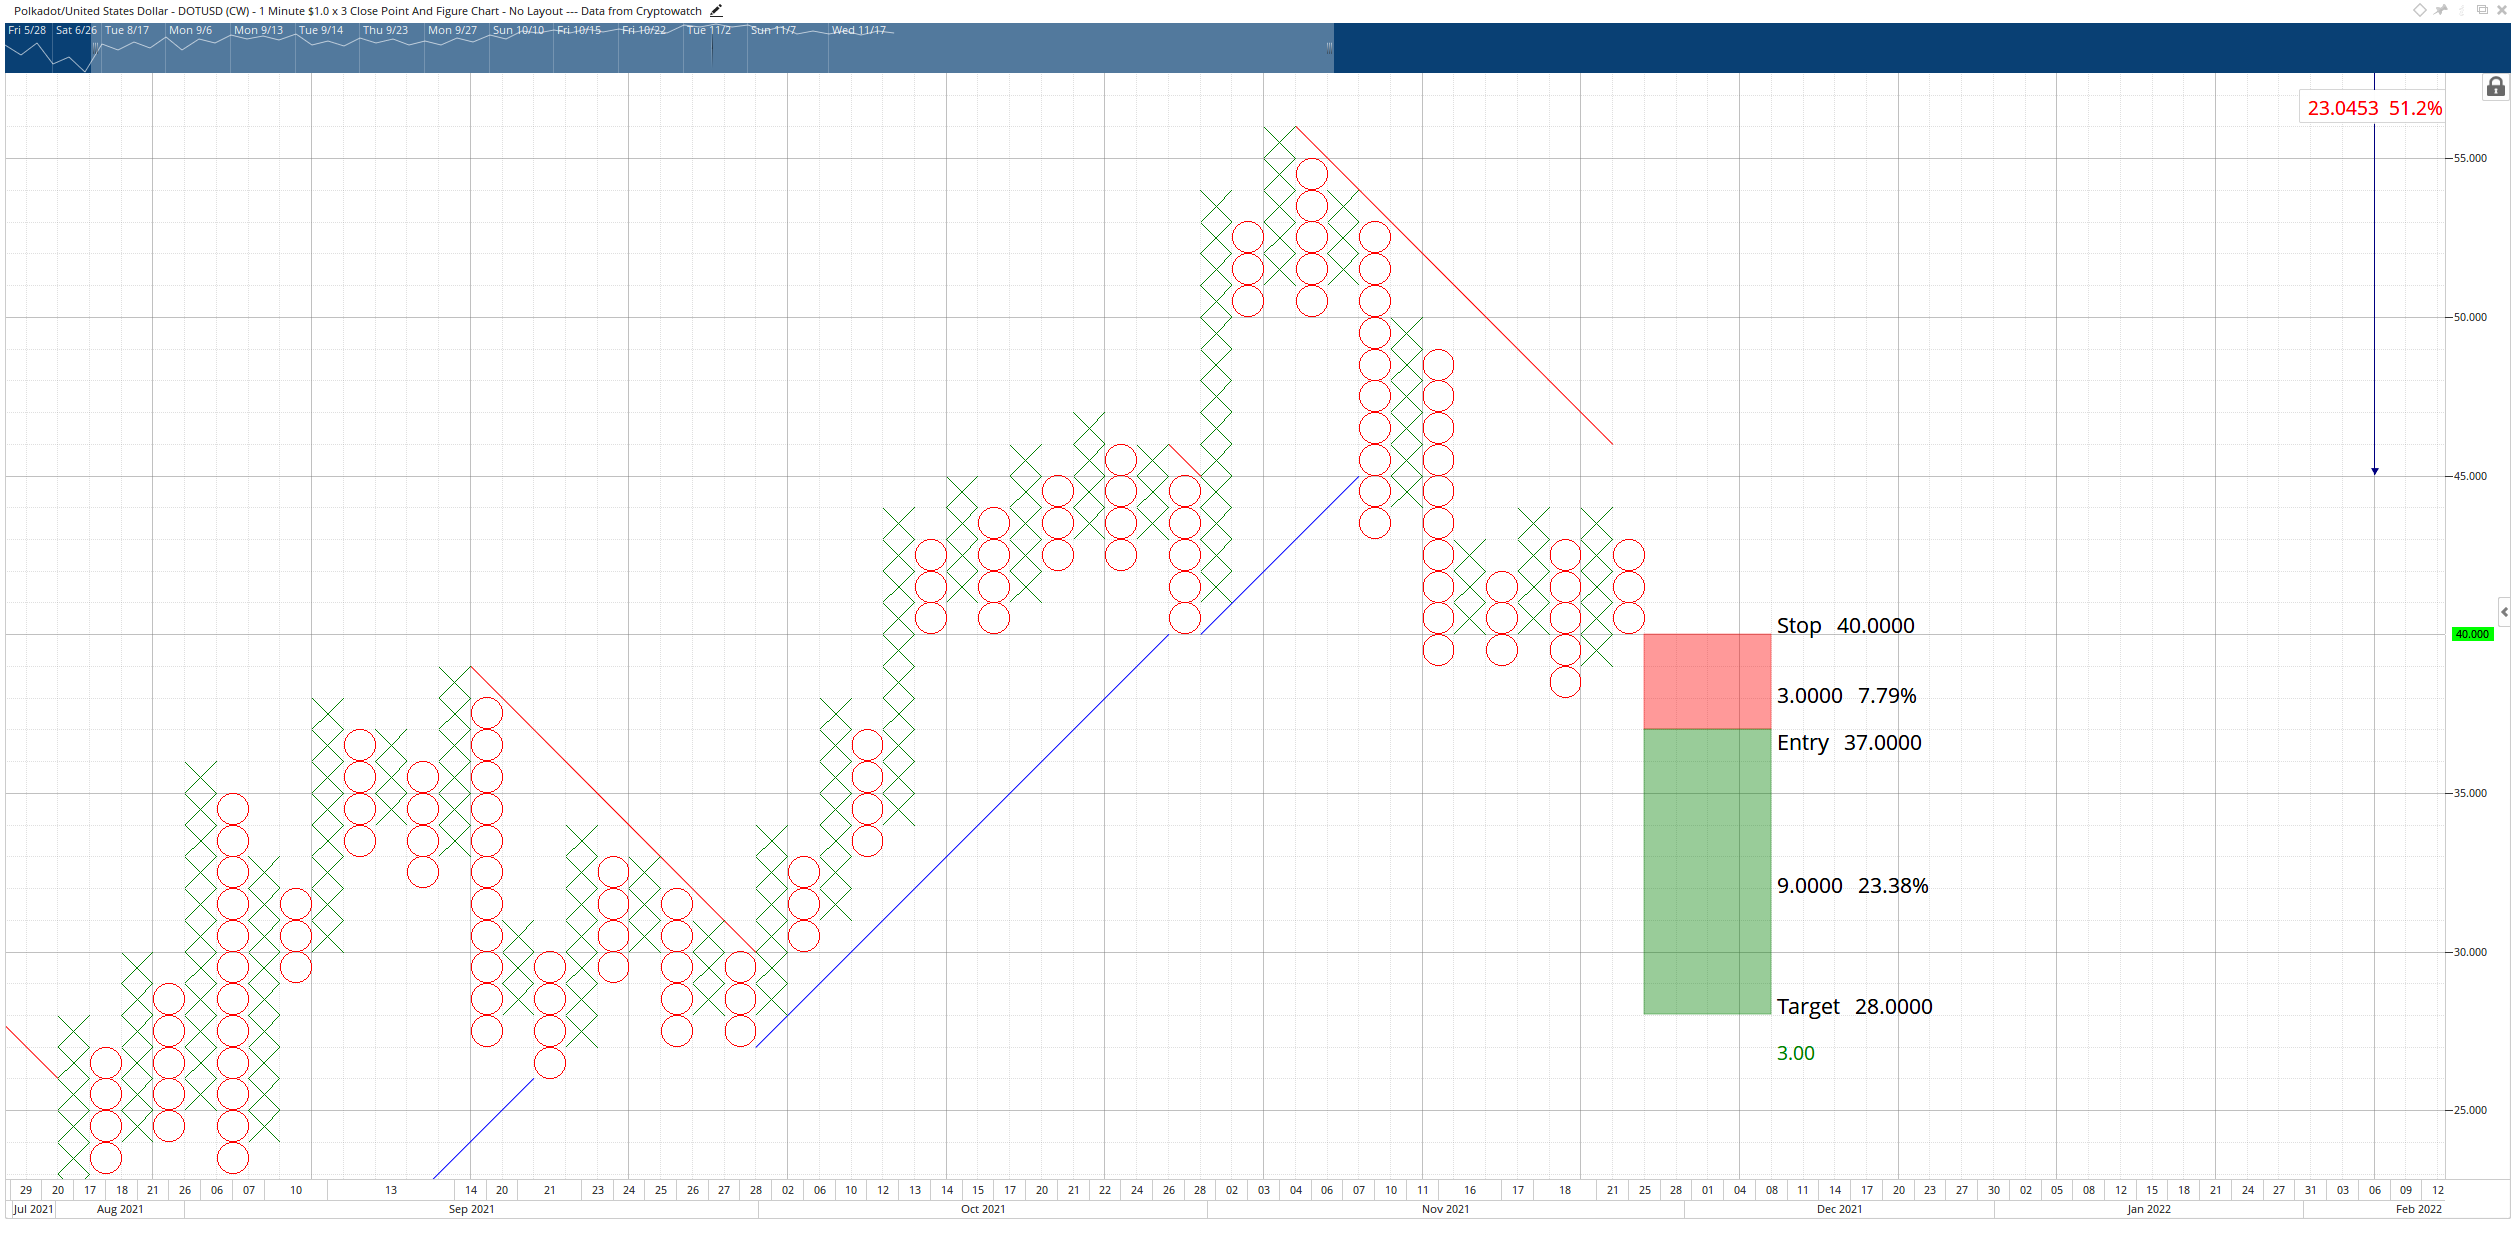
DOT/USDT $1.00/3-box Reversal Point and Figure Chart
This trade is invalidated if the long idea is triggered.
Traders on both sides of the market will want to be careful during this trading week as it is the Thanksgiving holiday week in the US. Expect sideways markets and an increase in volatility. Historically, wild price swings can occur with little to no warning.
Author

Jonathan Morgan
Independent Analyst
Jonathan has been working as an Independent future, forex, and cryptocurrency trader and analyst for 8 years. He also has been writing for the past 5 years.



