- Polkadot price seems to be facing some short-term selling pressure.
- Bulls need to defend a critical support level to prevent DOT from falling further.
Polkadot has rebounded strongly from its low at $4.43 established on November 26 and managed to reach $5.53, aiming to set a new 2020-high. Unfortunately, an important indicator suggests DOT is poised for a pullback in the short-term.
Polkadot price facing strong selling pressure
On the 9-hour chart, the TD Sequential indicator has presented a sell signal that seems to be getting a lot of follow-through bearish action. The 50-SMA is acting as a strong support level at $5.10.
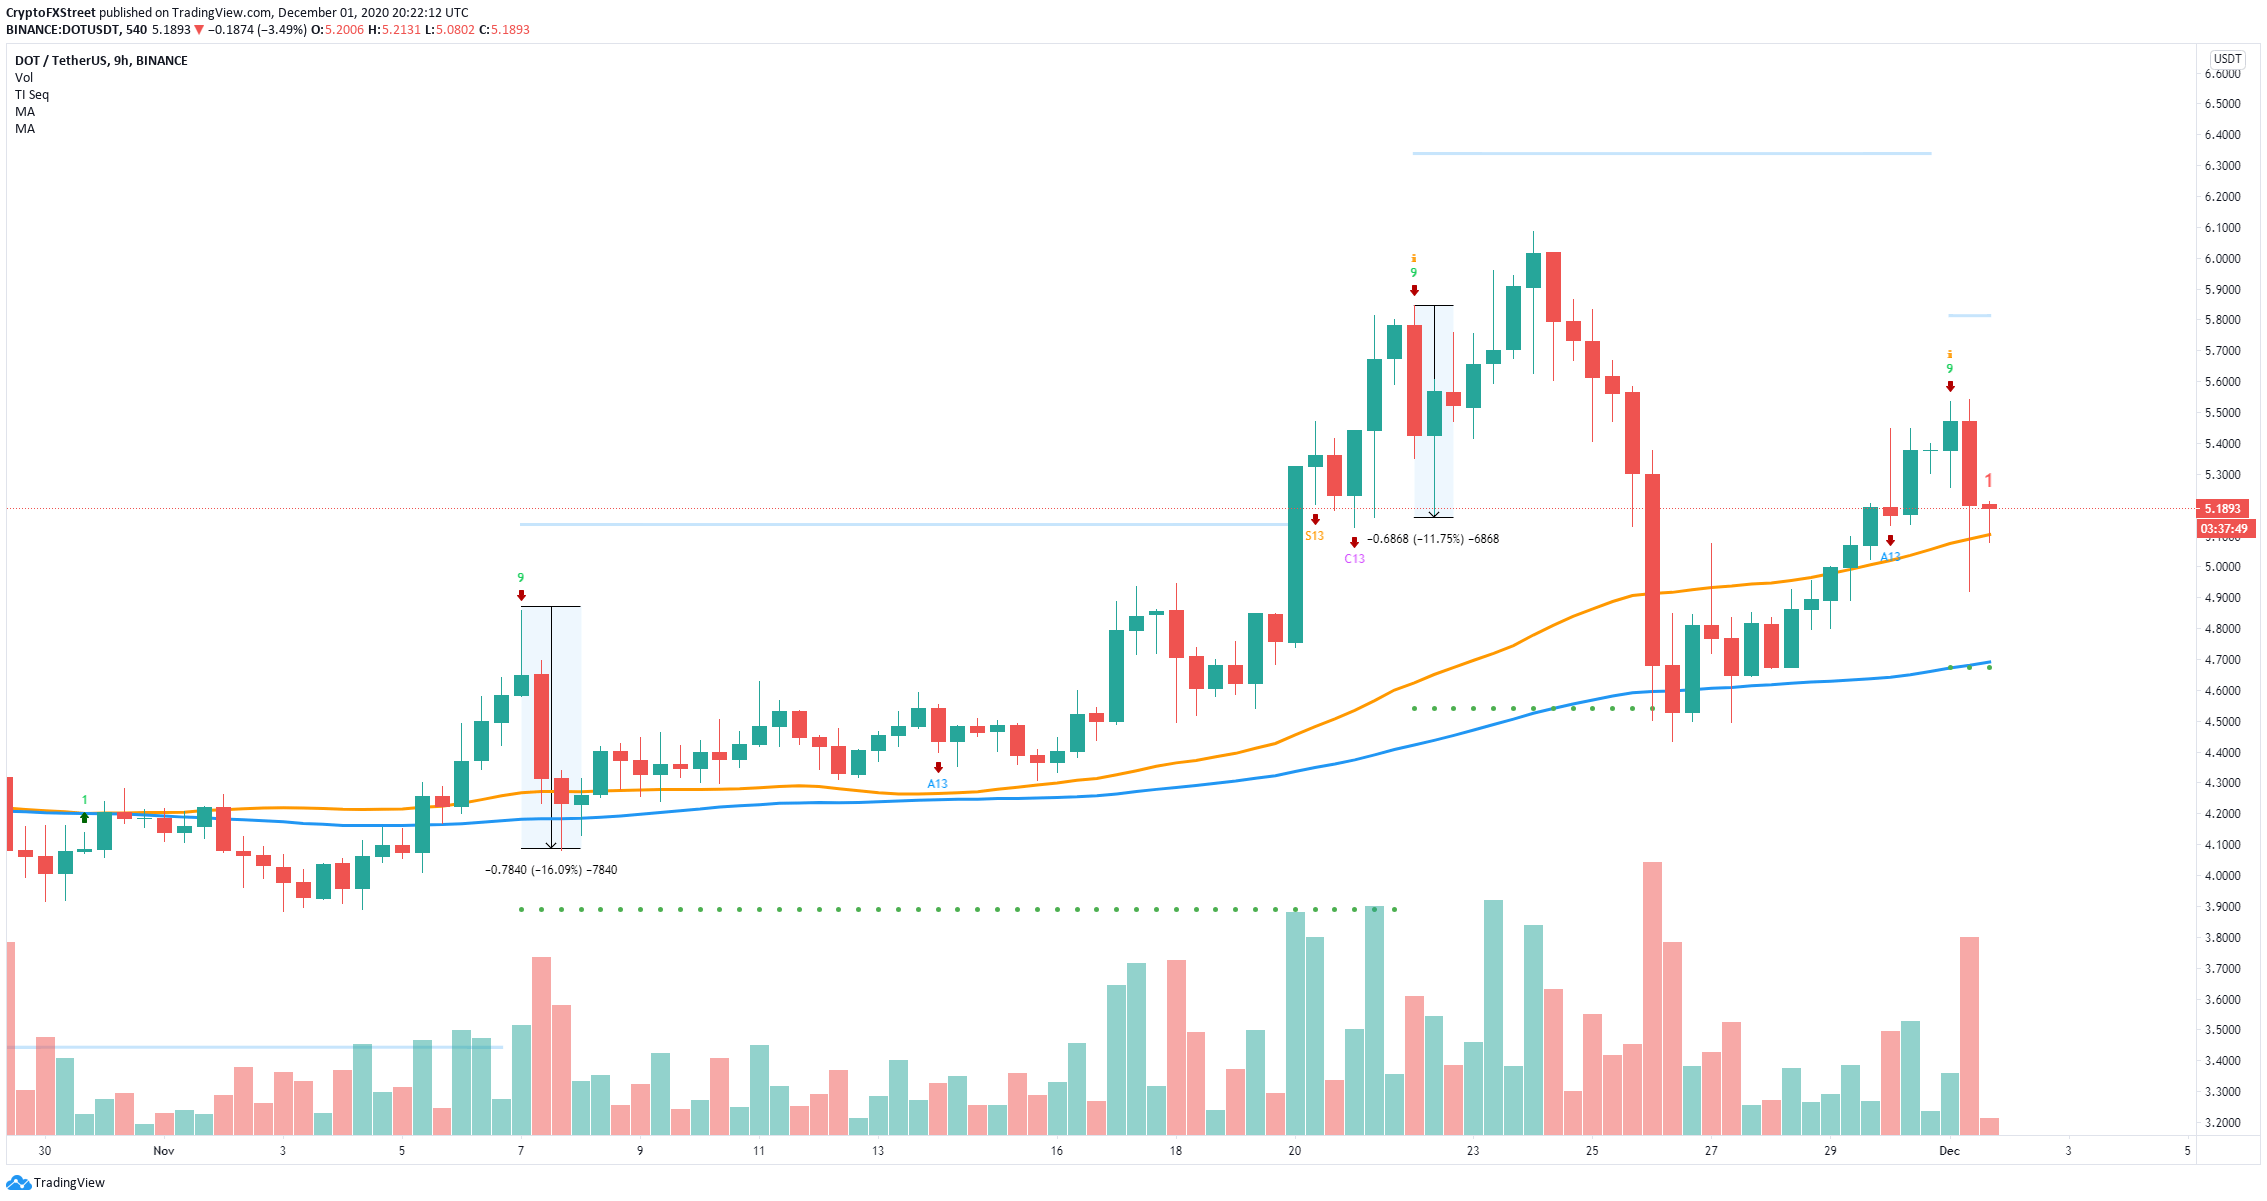
DOT/USD 9-hour chart
A breakdown below the 50-SMA would be a clear bearish sign capable of driving Polkadot price down to the 100-SMA at $4.7. Additionally, it seems that the TD Sequential is also on the verge of presenting a sell signal on the 3-day chart.
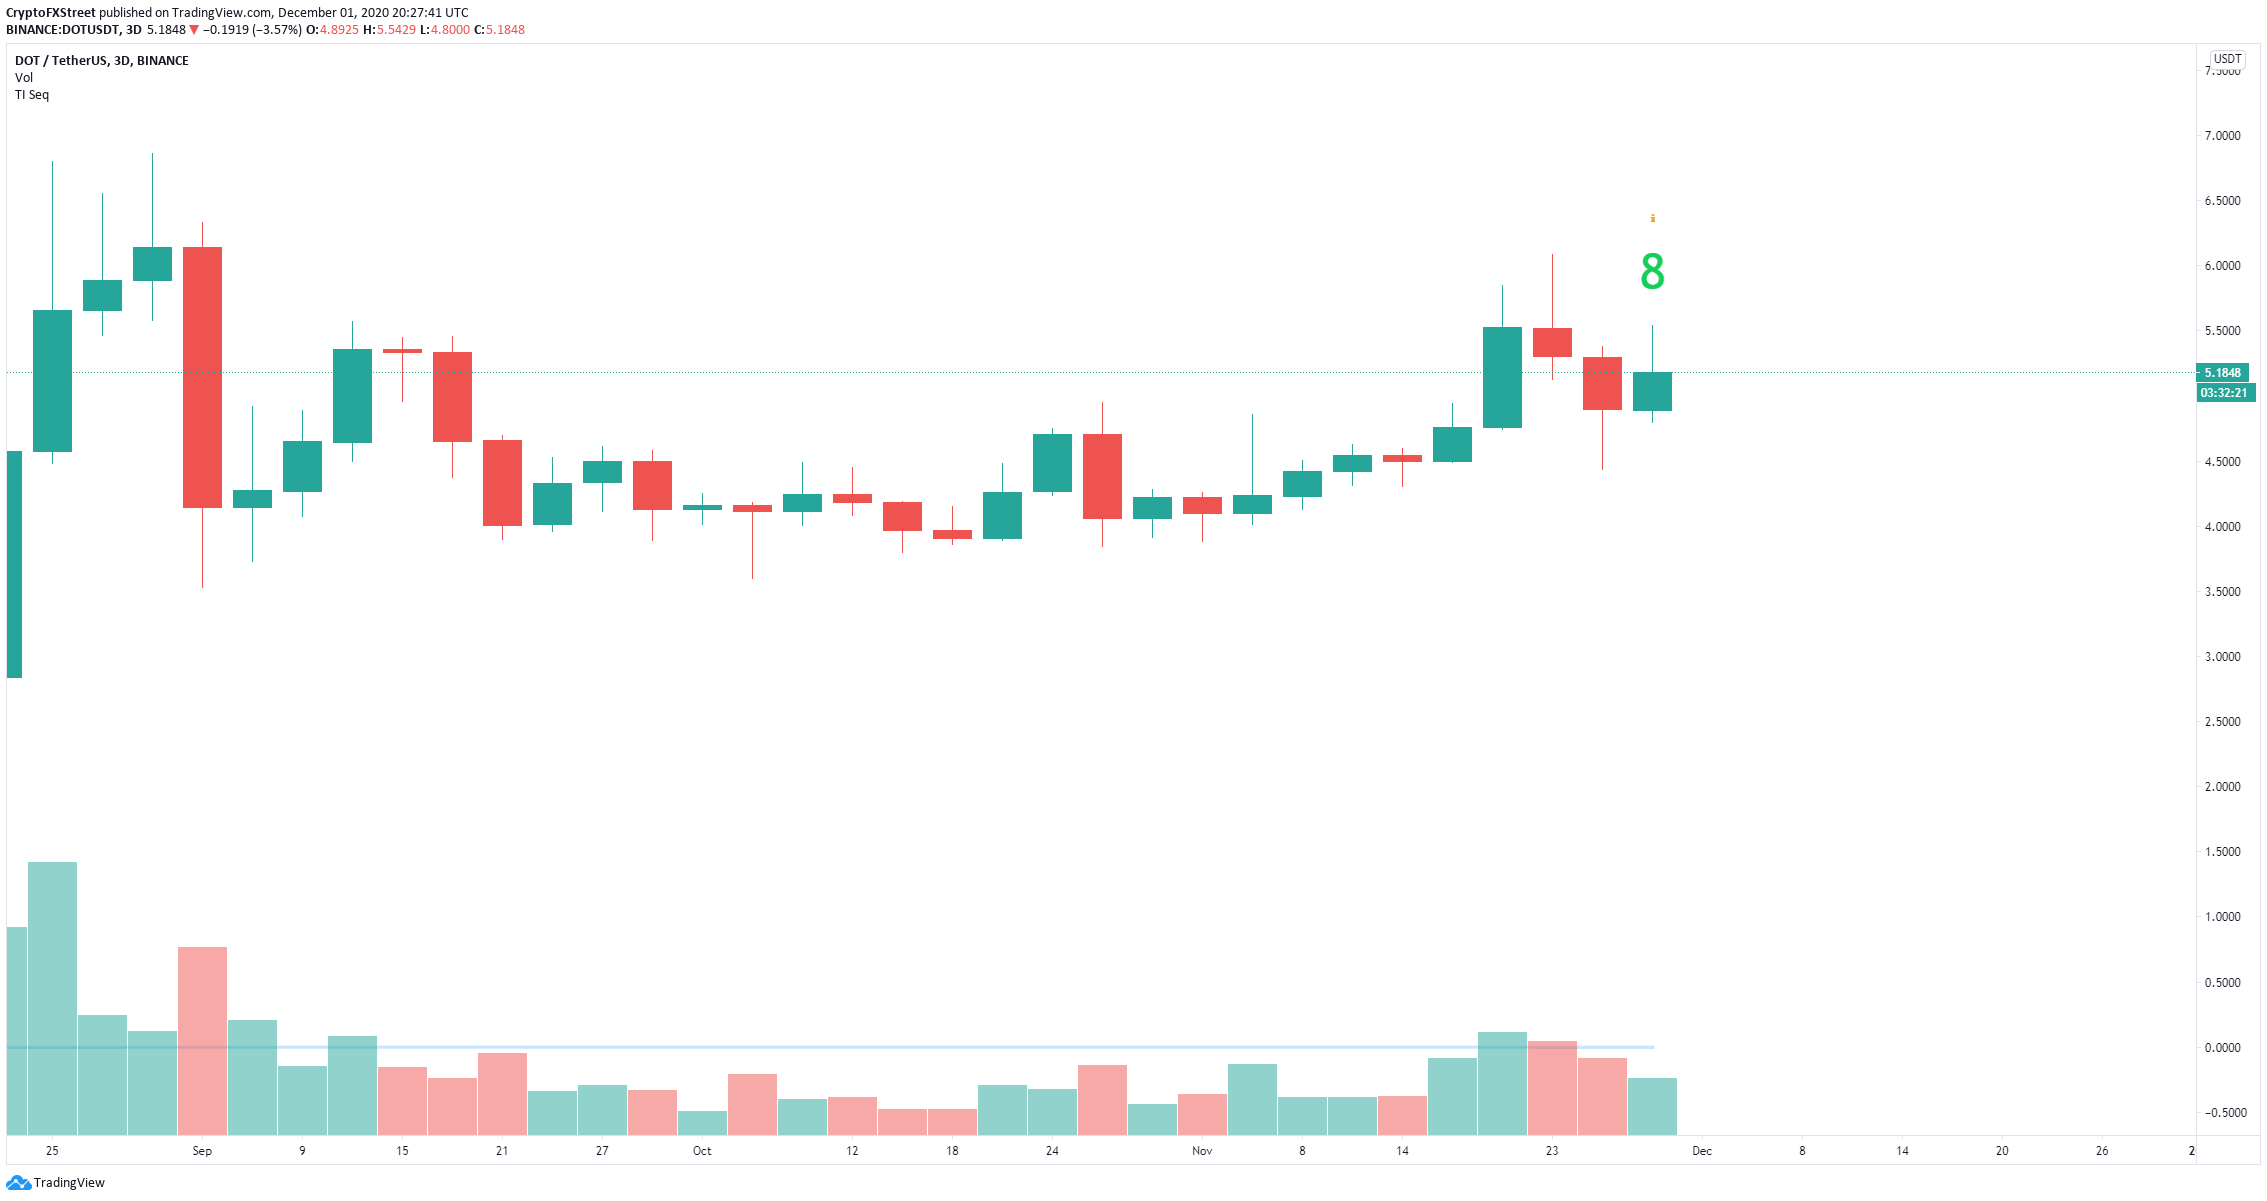
DOT/USD 3-day chart
The current green ‘8’ is a strong indication of a potential incoming green ‘9’ sell signal like the one in the 4-hour chart. This increase in selling pressure gives bears the upper hand in the short-term.
However, if the bulls can decisively defend the 50-SMA support level on the 9-hour chart and push Polkadot price above $5.5, the digital asset could quickly rise to new highs above the 2020-high at $6.08.
Information on these pages contains forward-looking statements that involve risks and uncertainties. Markets and instruments profiled on this page are for informational purposes only and should not in any way come across as a recommendation to buy or sell in these assets. You should do your own thorough research before making any investment decisions. FXStreet does not in any way guarantee that this information is free from mistakes, errors, or material misstatements. It also does not guarantee that this information is of a timely nature. Investing in Open Markets involves a great deal of risk, including the loss of all or a portion of your investment, as well as emotional distress. All risks, losses and costs associated with investing, including total loss of principal, are your responsibility. The views and opinions expressed in this article are those of the authors and do not necessarily reflect the official policy or position of FXStreet nor its advertisers.
Latest Crypto News & Analysis
Editors’ Picks
Cardano Price Forecast: ADA targets 900% bull rally, but it must clear $0.33 first
Cardano had a significant rally towards $0.355 at the beginning of 2021. After a notable dip to $0.228, bulls bought it and managed to push Cardano price to $0.33 again before a small rejection.
Ethereum price aims to flush out doubters before the ultimate breakout to $2,000
Ethereum bulls bought the dip on January 11, pushing the digital asset from a low of $915 towards $1,256. The smart-contracts giant has been outperforming Bitcoin in the past 24 hours despite the negativity seen on social media.
XLM Price Prediction: Stellar consolidates ahead of a 30% move
XLM price trades at $0.291 at the time of writing after a healthy consolidation after hitting a 2021-top at $0.411. There is a high chance that XLM is about to see a massive breakout or breakdown within the next 24 hours.
Bitcoin Weekly Forecast: BTC price faces extreme volatility ahead of a new all-time high
Bitcoin had a wild run this week, dropping from a high of $41,350 to a low of 30,420 in less than 48 hours. The panic sell-off was stopped on its tracks at the 26-EMA on the daily chart as bulls quickly bought the dip and created a V-Shape recovery pushing BTC towards $40,100 again.
Bitcoin Weekly Forecast: BTC price faces extreme volatility ahead of a new all-time high
Bitcoin had a wild run this week, dropping from a high of $41,350 to a low of 30,420 in less than 48 hours.