Polkadot Price Prediction: DOT must close above this crucial level to sustain the uptrend targeting $6.5
- Polkadot holds firmly to the uptrend after ignoring the formation of a double-top pattern.
- A daily close above the ascending channel middle boundary could boost DOT uptrend further up.

Polkadot has grown consistently in the last couple of weeks to the extent of closing above $5 for a few days. On the upside, the price movement has been capped under $6. For now, all the attention is being channelled to breaking above the ascending parallel channel middle boundary layer to sustain the uptrend.
Polkadot uphill battle to break critical barrier
As mentioned, the rally in the last two weeks has been consistent within an ascending parallel channel's confines. The multiple rejections at the channel upper boundary have delayed the breakout that continues to eye $6.5.
Meanwhile, Polkadot is trading at $5.6 while fighting to break the channel's middle boundary resistance. If DOT closed above this crucial level, the uptrend might sustain, bringing into the light a bullish outlook. Similarly, a spike above the channel might result in massive gains, even overshooting the short-term target at $6.5.
The Relative Strength Index has confirmed the likelihood of the uptrend, sailing through after bouncing off support at the midline. At the time of writing, the RSI moves towards the overbought territory, thus suggesting that the bullish grip is getting stronger.
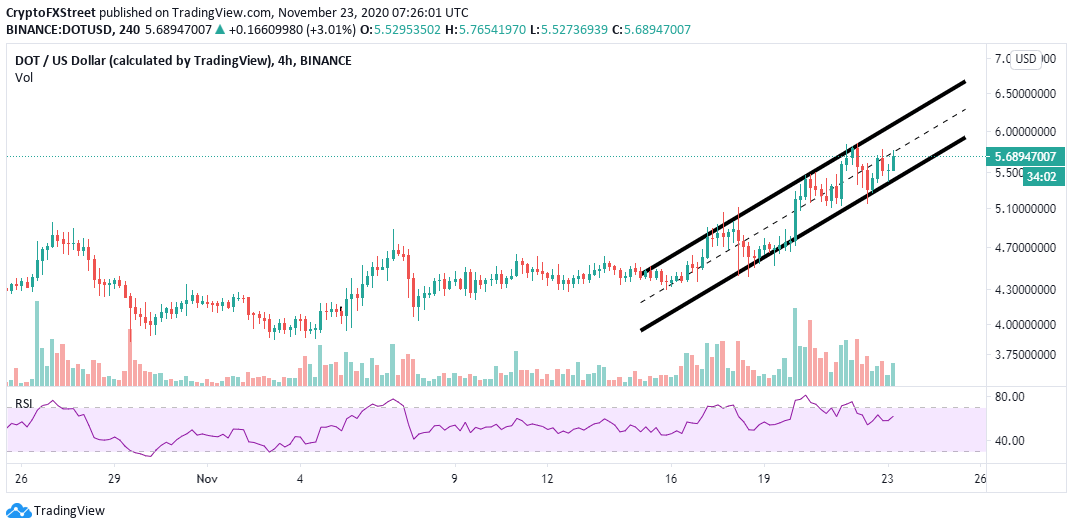
DOT/USD 4-hour chart
The 12-hour chart highlights the formation of a double-top pattern that is likely to be ignored, thus validating the uptrend. Note that double-tops are bearish chart patterns that indicate that a correction is nigh. They are formed when the price of an asset hits the same peak twice.
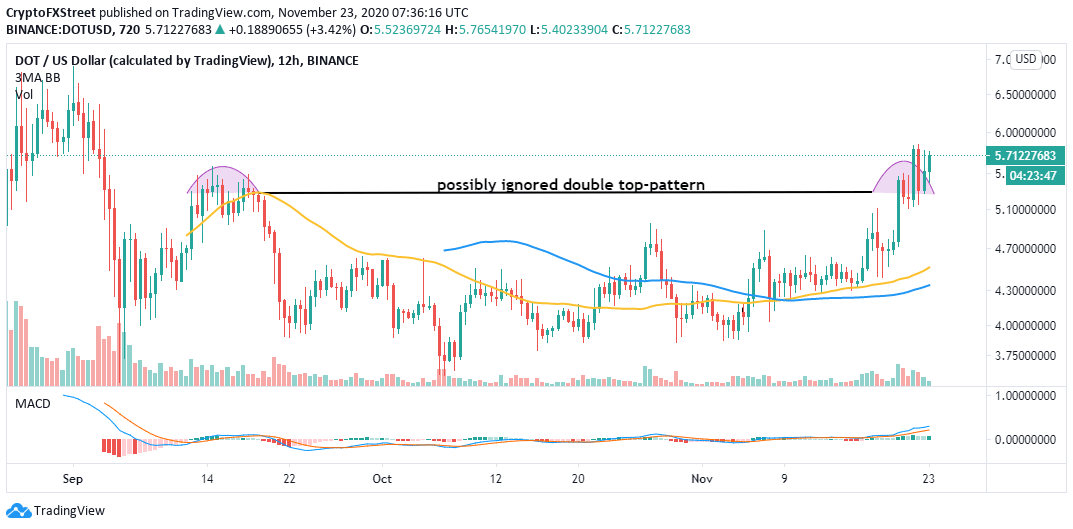
DOT/USD 12-hour chart
Polkadot's rally delay occurred on hitting the second top, but the uptrend seems to be resuming. Therefore, the price could spike higher. Besides, the Moving Average Convergence Divergence (MACD) shows that the odds favor the bulls, at least for now.
The TD Sequential indicator is likely to flash a sell signal on the daily chart in the coming sessions. The call will take the form of a green nine candlestick and may lead to a correction in one to four daily candlesticks.
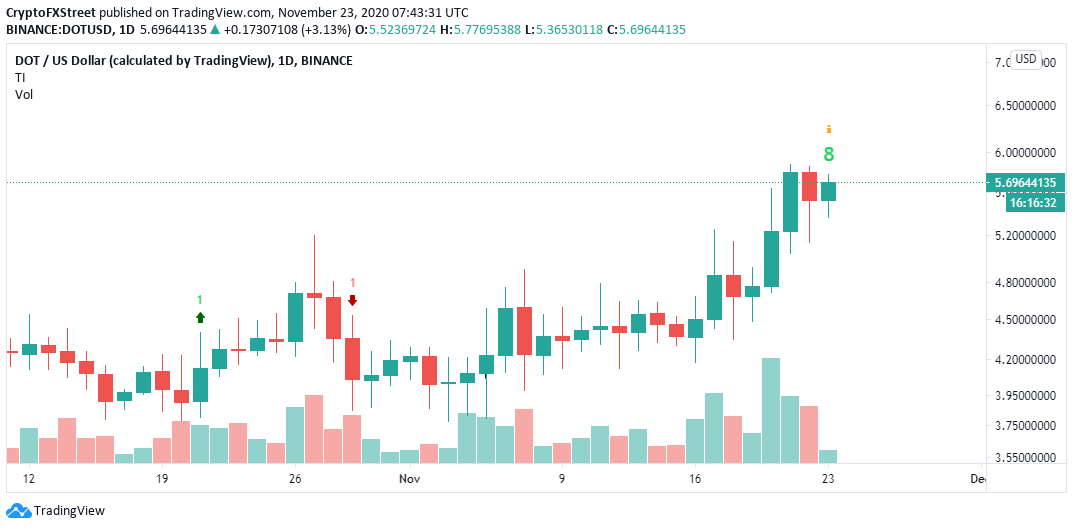
DOT/USD daily chart
On the other hand, if DOT/USD fails to close above the channel's middle boundary, a reversal may also come into the picture. Selling orders are likely to increase, forcing Polkadot to seek refuge in the range between the 100 Simple Moving Average on the 4-hour chart at $5 and the 200 SMA at $4.5.
Author

John Isige
FXStreet
John Isige is a seasoned cryptocurrency journalist and markets analyst committed to delivering high-quality, actionable insights tailored to traders, investors, and crypto enthusiasts. He enjoys deep dives into emerging Web3 tren


