Polkadot Price Forecast: DOT suffers another rejection amid intensifying selling signals
- Polkadot upswing from the support at $26 has hit a barrier at $38.
- The ongoing correction occurs in the wake of the TD Sequential sell signal on the 12-hour chart.
- The SuperTrend indicator recently presented a buy signal, likely to invalidate the downswing.

Polkadot is battling with rising overhead pressure following a rejection at $38. Before the recent upswing, the token had dropped significantly from the all-time high of $42. Support established at $26 allowed bulls the opportunity to push DOT above $30. Meanwhile, massive declines are likely to come into the picture unless higher support is embraced.
Polkadot bows under rising overhead pressure
The TD Sequential indicator has recently flashed a sell signal in the form of a green nine candlestick on the 12-hour chart. The call to sell identifies positions where the bullish momentum is losing strength. This implies that the bears are increasing their positions. As overhead pressure surges, a correction comes into play. If the sell signal is validated, Polkadot may fall in one to four 12-hour candlesticks.
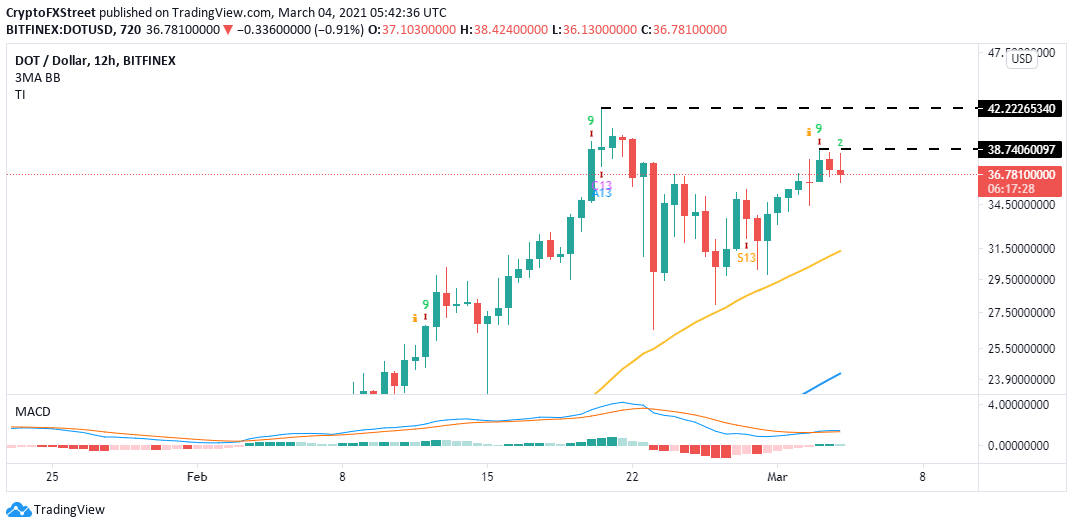
DOT/USD 12-hour chart
Support must be secured, preferably at the 50 Simple Moving Average on the 12-hour chart. Otherwise, Polkadot could freefall back to the support at $26. If push comes to shove and the bearish leg stretches further, the 100 SMA will come in handy.
Looking at the other side of the picture
The 4-hour chart brings to light the long signal by the SuperTrend indicator. Traders are signified to buy when this technical pattern turns from red to green while moving below the asset’s price. As long as the SuperTrend indicator remains bullish, Polkadot’s downside will be protected.
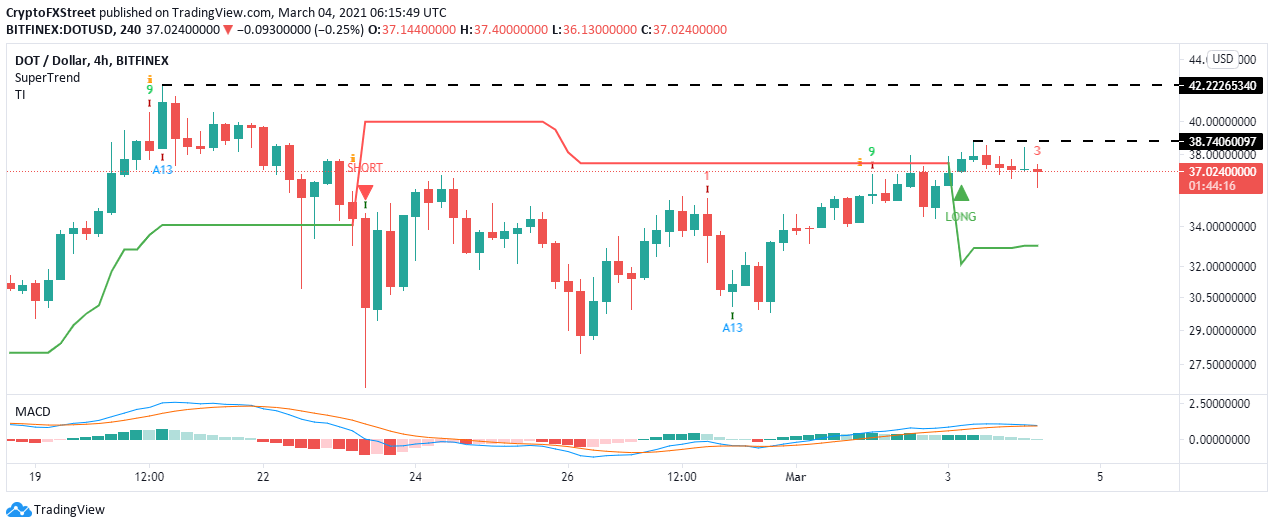
DOT/USD-hour chart
It is worth mentioning that the moving Average Convergence Divergence (MACD) has a bullish impulse, thus validating the SuperTrend. However, the MACD has to stay above the midline to avoid crossing below the signal line for the bullish narrative to hold.
Author

John Isige
FXStreet
John Isige is a seasoned cryptocurrency journalist and markets analyst committed to delivering high-quality, actionable insights tailored to traders, investors, and crypto enthusiasts. He enjoys deep dives into emerging Web3 tren


