Polkadot Price Prediction: DOT hints at a 12% drop as two indicators flash a “sell” sign
- Polkadot price is getting squeezed between two converging trendlines indicating consolidation in play.
- Considering the previous price trend, DOT is in a bullish pennant formation, suggesting a 64% upswing.
- However, the sell signal flashed by two technical indicators hints that the bullish breakout might have to wait.

Polkadot price entered a consolidation phase after hitting a local top of $42.39 on February 20. Now, DOT faces a confluence of sell signal from two accurate indicators, which reveal the possibility of an incoming drop.
Polkadot price prepares for a downswing
Polkadot price saw a 180% upswing starting from January 27, soon after, the bullish momentum exhausted, resulting in consolidation. DOT followed this phase by getting squeezed between two trendlines forming lower highs and higher lows, which created a pennant.
Considering the price action since January 27, Polkadot seems to be in a continuation pattern known as “bullish pennant.” This technical formation suggests that a breakout will result in a continuation of the previous price trend. The target is determined by adding the flag pole’s height to the breakout point at $37.8, which puts DOT at $62.27.
Although the pattern is inherently bullish, the SuperTrend indicator’s sell signal has coincided with the Tom DeMark (TD) Sequential indicator’s sell signal presented in the form of a green nine candlestick on the 12-hour chart. The latter indicator’s signal forecasts a one-to-four candlestick correction. Hence, Polkadot price can be expected to slide 12% to hit its short-term target of $31.85 or the 61.8% Fibonacci retracement level.
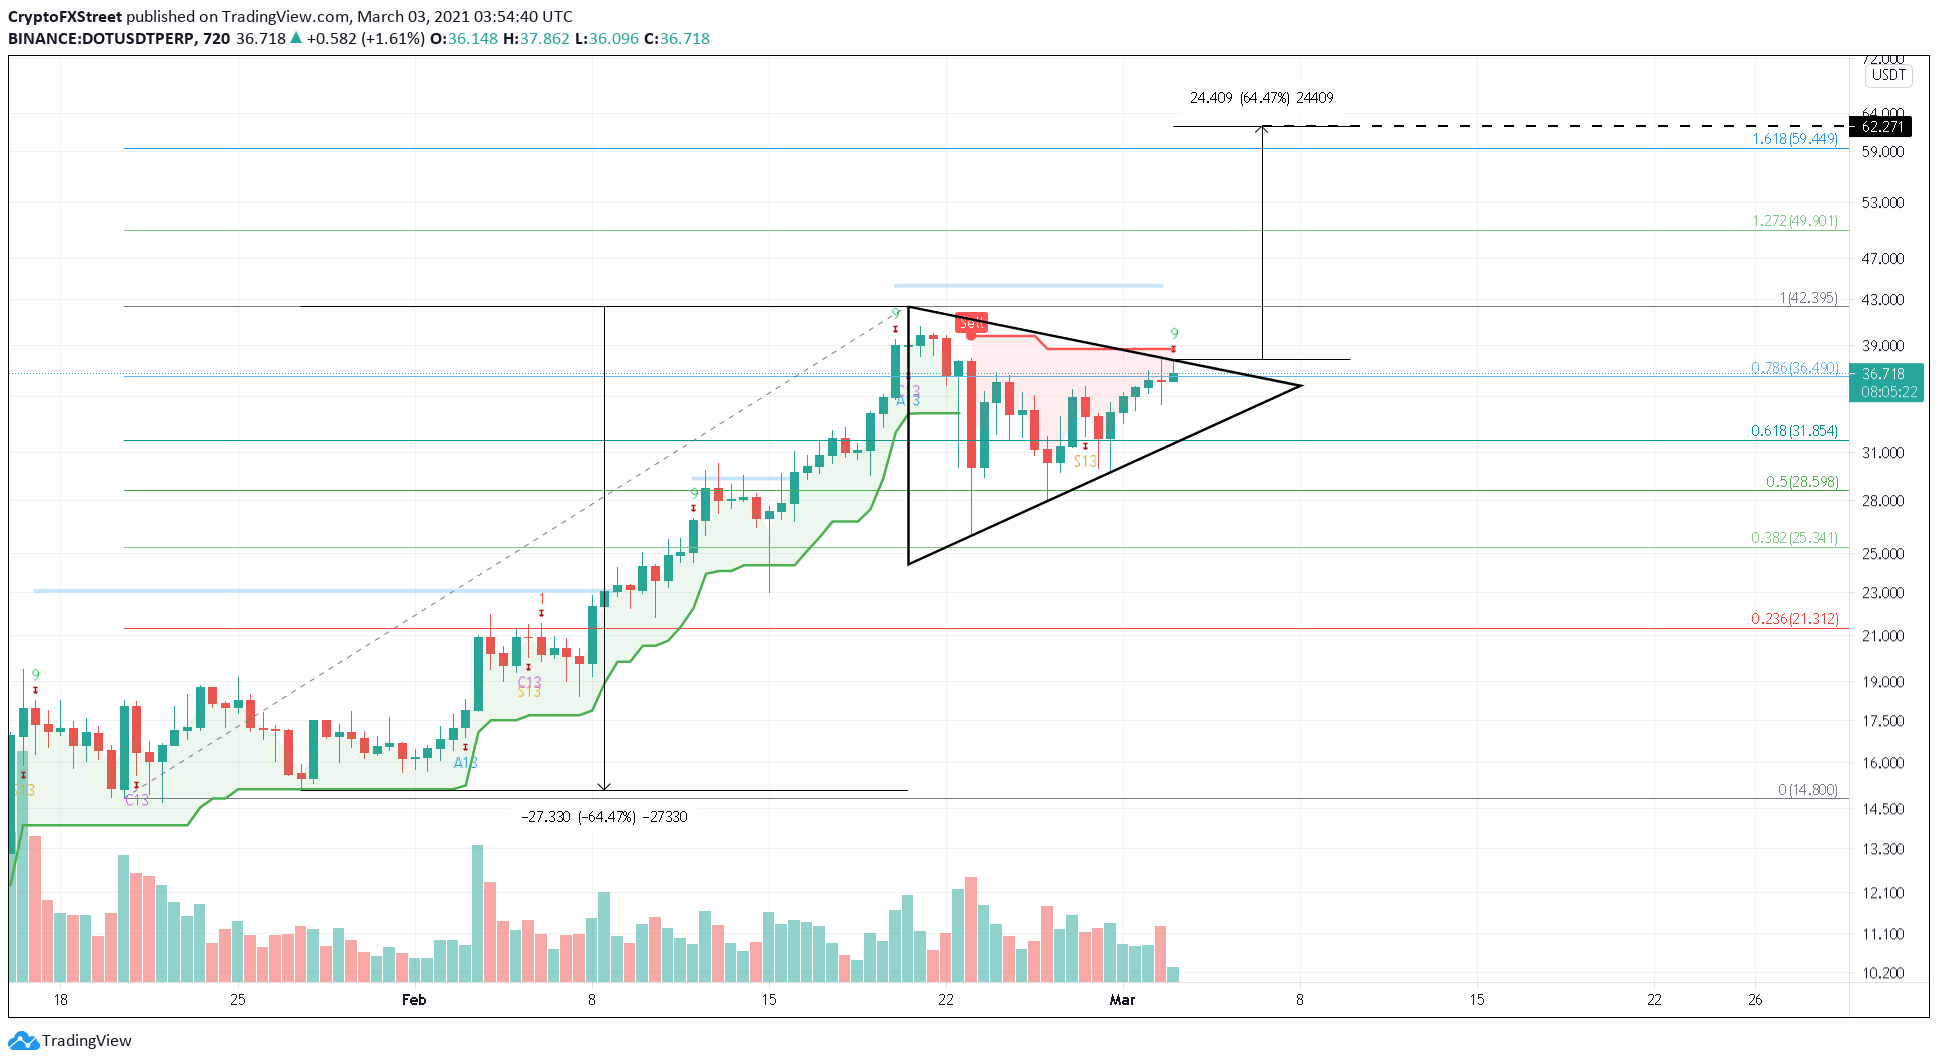
DOT/USDT 12-hour chart
Although a 12-hour candlestick close above $37.8 would signal a breakout of the bullish pennant formation, only a close above $40 will signal a higher high. In such a case, Polkadot price can be expected to surge 55% to hit $62.72.
Author

Akash Girimath
FXStreet
Akash Girimath is a Mechanical Engineer interested in the chaos of the financial markets. Trying to make sense of this convoluted yet fascinating space, he switched his engineering job to become a crypto reporter and analyst.


