|

Polkadot price targets $44, but faces significant long-term selling pressure

  • Polkadot price is bounded inside a symmetrical triangle pattern on the 4-hour chart.
  • The digital asset is on the brink of a significant 25% breakout towards $44.
  • DOT could continue to trade sideways for the next few days if there is no clear breakout.

Polkadot price has significantly rebounded from a low of $29.7 on February 28 but continues trading sideways inside a tightening pattern on the 4-hour chart. Bulls aim for a breakout above the critical resistance level at $35 while bears hope for another rejection.

Polkadot price needs to crack this key level

On the 4-hour chart, Polkadot has established a symmetrical triangle pattern and it’s on the verge of a breakout above the key resistance level at $35. Climbing above this point would lead Polkadot price towards $44, a 25% move calculated using the height of the pattern as a reference point. 

dot price

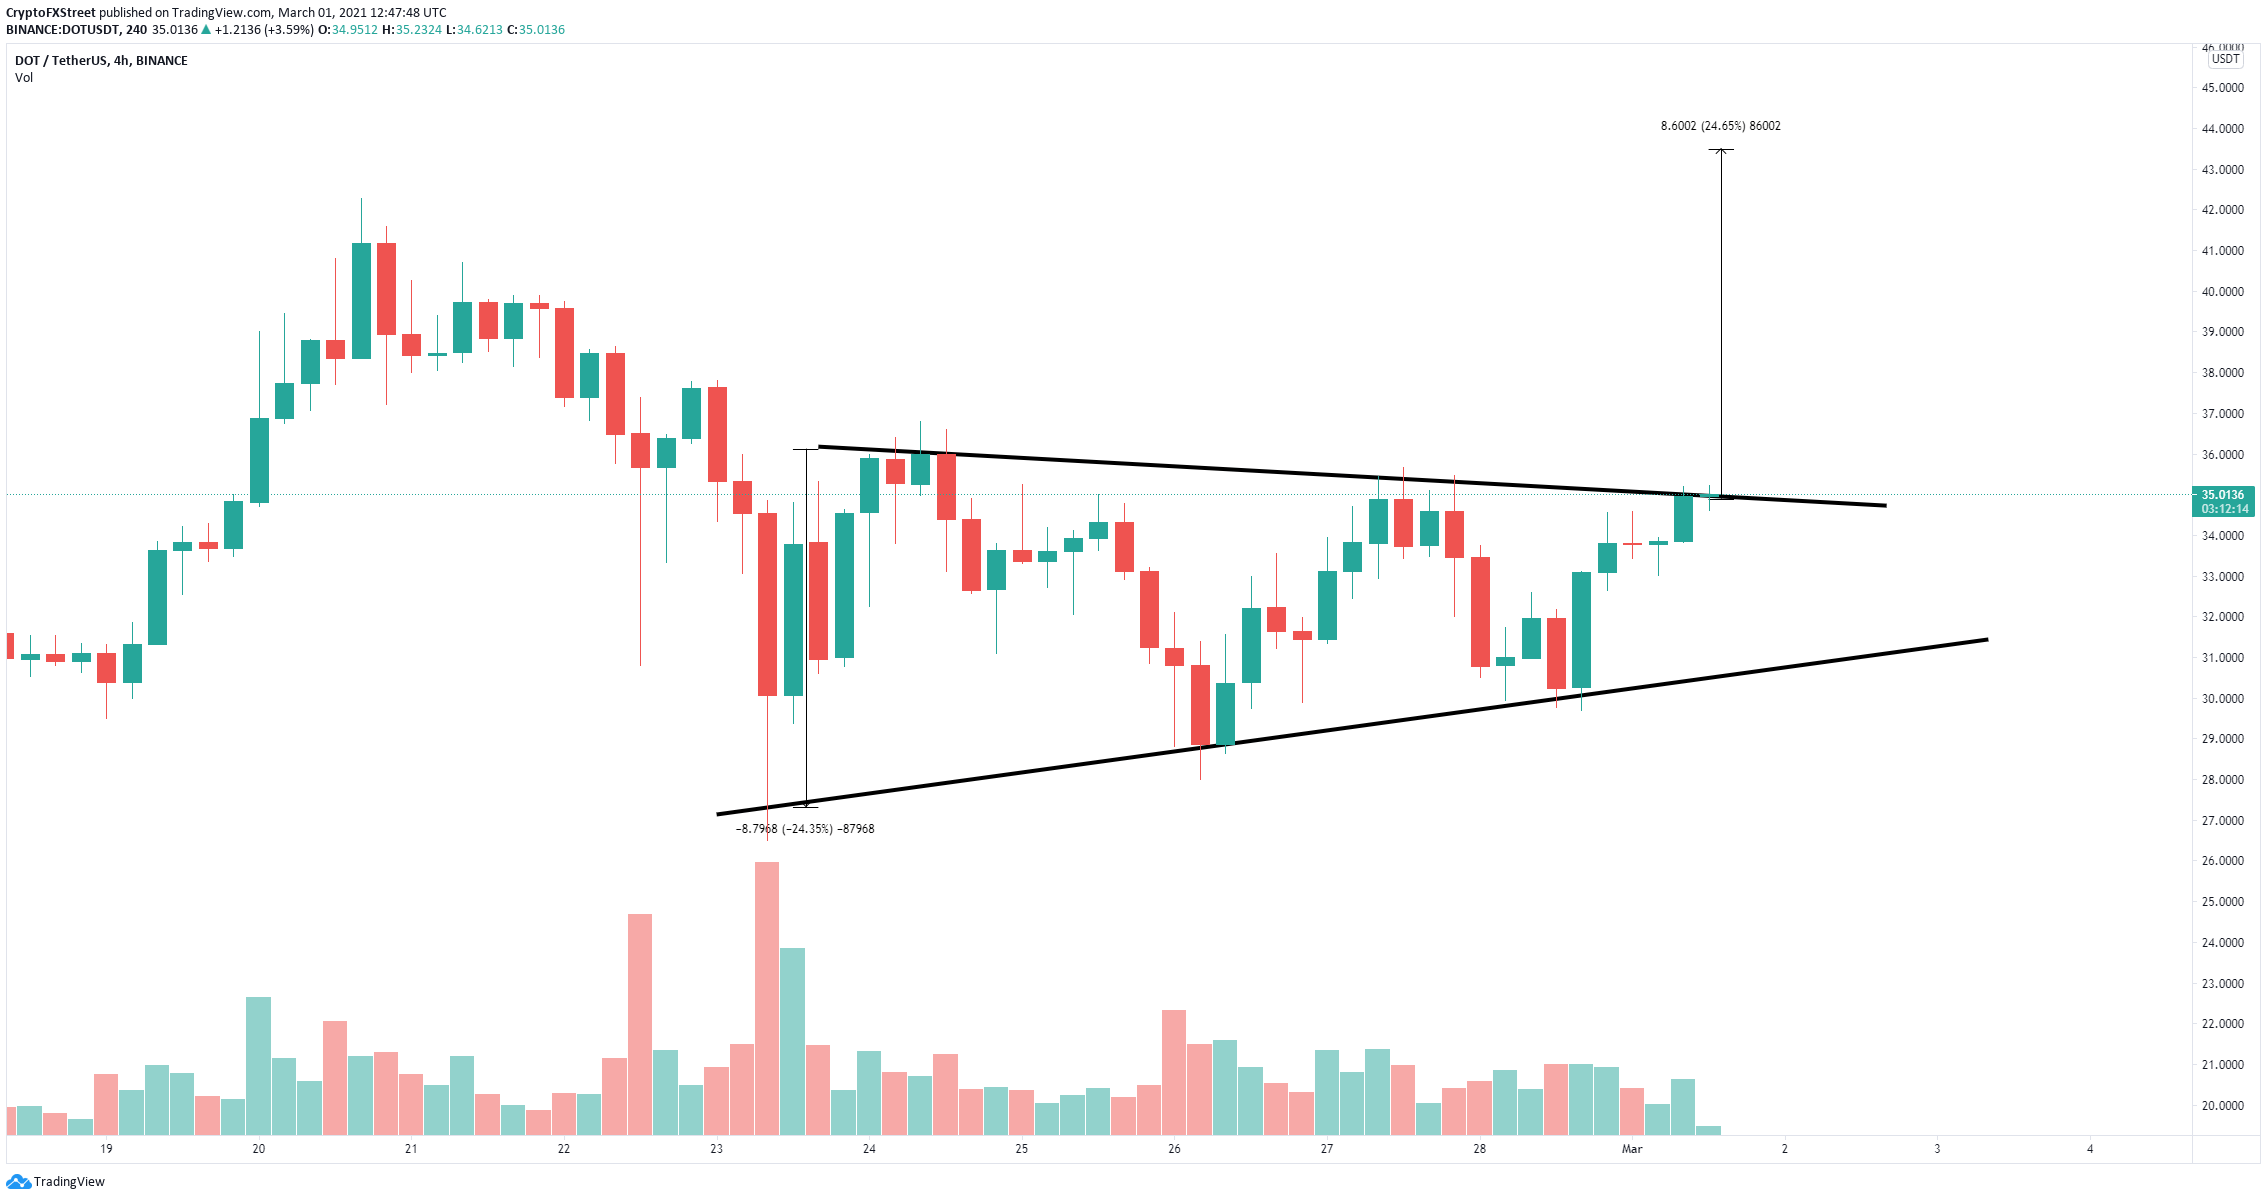
DOT/USD 4-hour chart

However, rejection from the key resistance level of $35 would be notably bearish and likely to drive Polkadot price down to the lower boundary of the pattern at $31. 
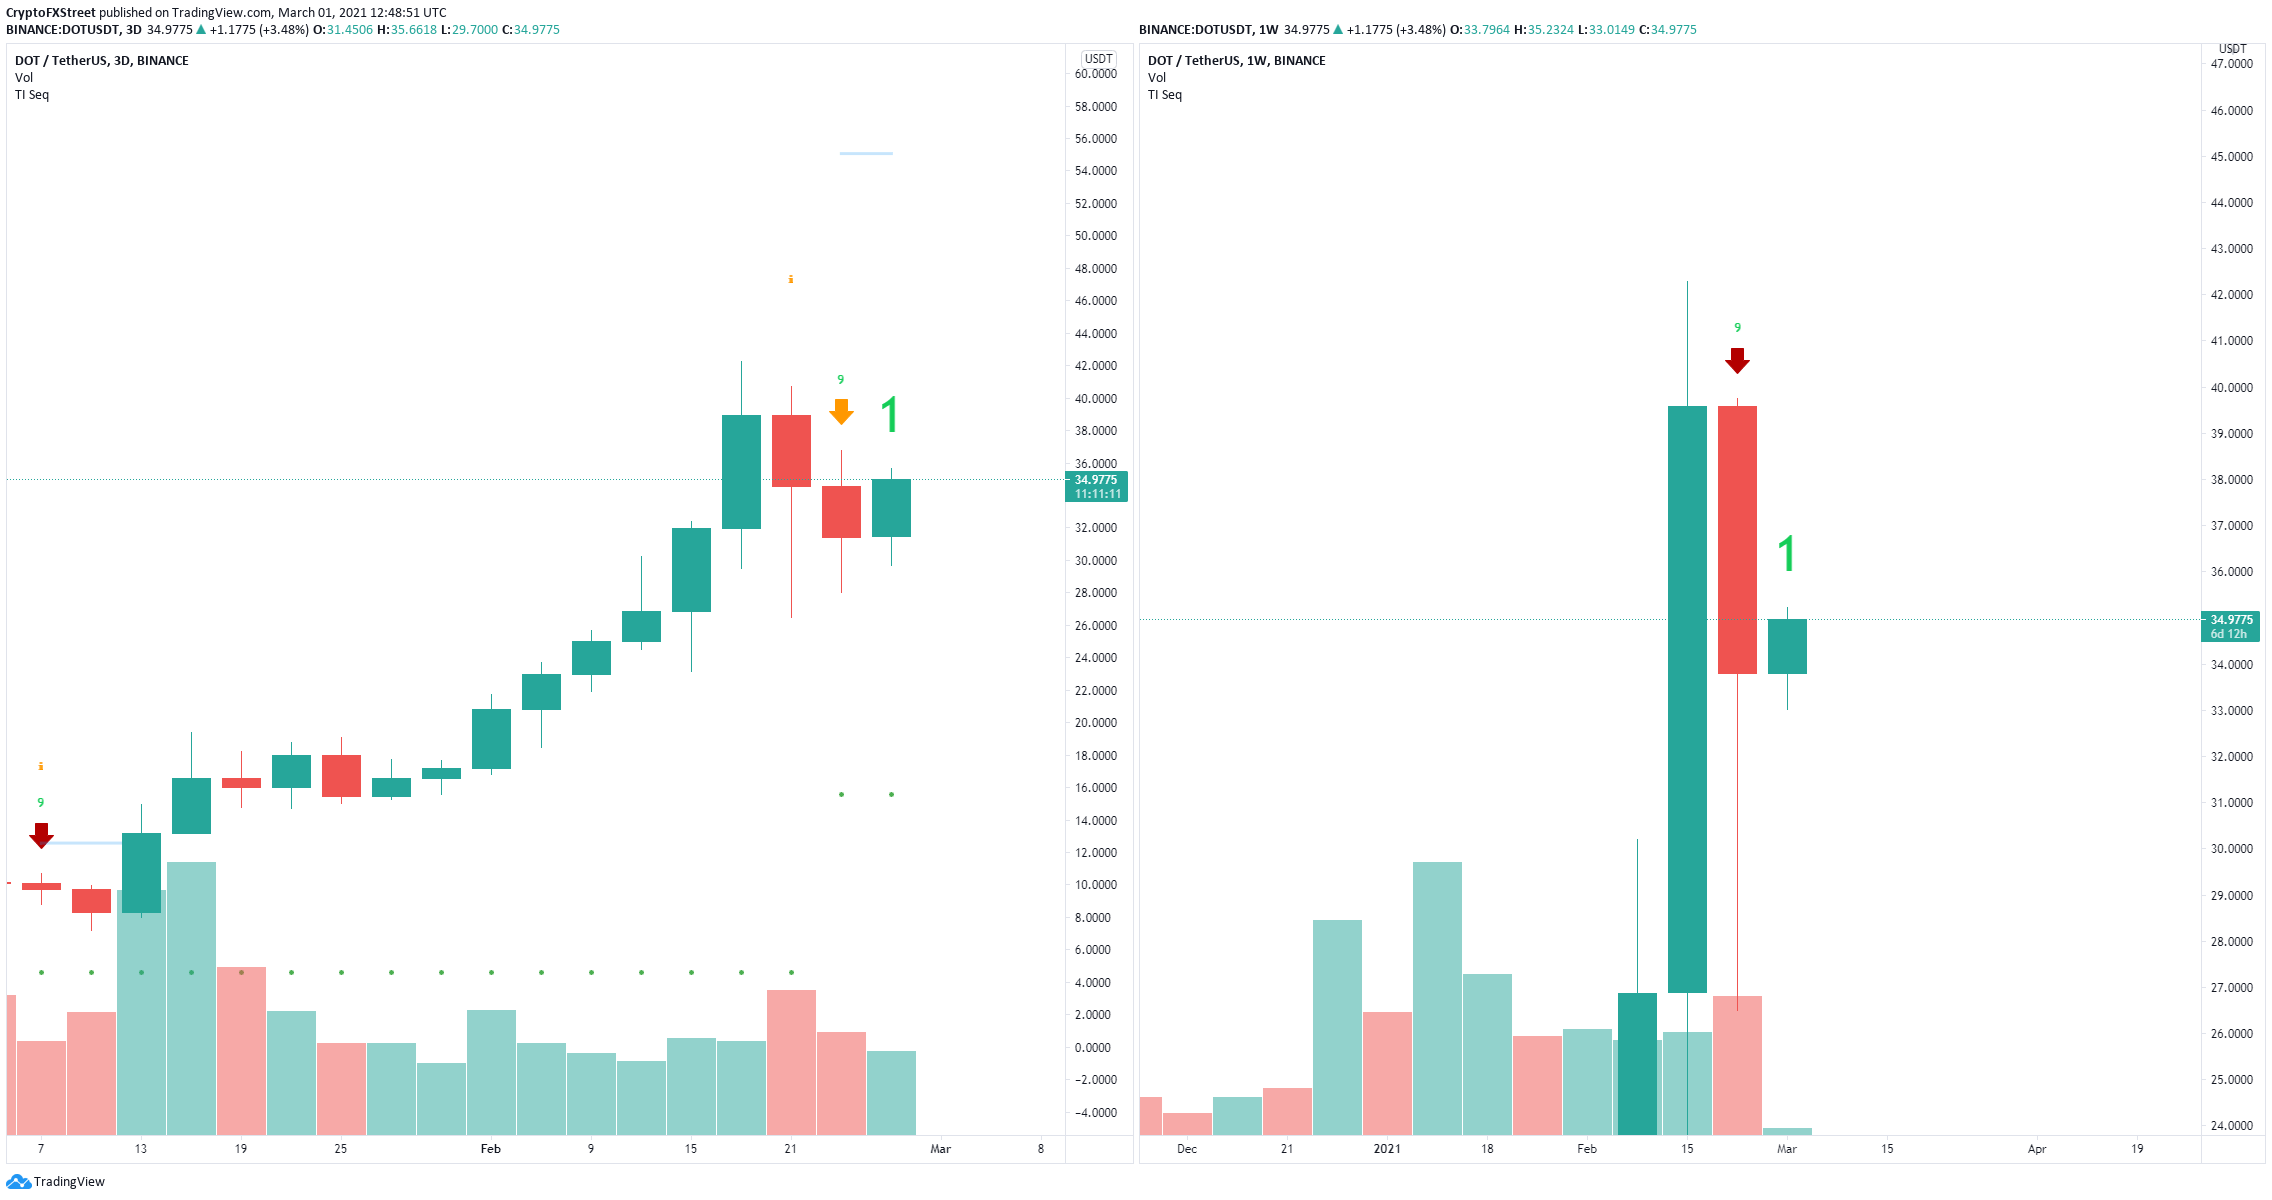
dot price

DOT Sell Signals

The TD Sequential indicator has presented sell signals on the 3-day and weekly charts, adding a lot of pressure to the bulls and credence to the bearish outlook.

Author

Lorenzo Stroe

Lorenzo Stroe

Independent Analyst

Lorenzo is an experienced Technical Analyst and Content Writer who has been working in the cryptocurrency industry since 2012. He also has a passion for trading.

More from Lorenzo Stroe
Share:

Editor's Picks

Hyperliquid Price Forecast: HYPE rises on commodities demand amid US-Iran war

Hyperliquid (HYPE) steadies above $33 at press time on Tuesday, marking its fourth consecutive day of recovery in a broadly volatile market due to the ongoing US-Israel strikes on Iran.

Stellar Price Forecast: XLM risks deeper losses as derivatives metrics turn negative

Stellar is trading red below $0.16 at the time of writing, after a slight recovery the previous day. Weakening derivatives data caps the recovery, while an unfavorable technical outlook projects a deeper correction for the XLM token in the upcoming days.

Aave Price Forecast: AAVE tests channel resistance as ParaFi Capital deposit, bearish derivatives data caps upside

Aave (AAVE) trades around $120 on Tuesday, testing the channel resistance, signaling that sellers remain active in the zone. Lookonchain data shows that ParaFi Capital transferred 42,000 AAVE tokens to Coinbase Prime over the past 10 hours, often interpreted as a potential selling signal.

CME Group's futures suite now covers over 75% of total crypto market cap

CME Group announced that its crypto futures offering now covers over 75% of the total digital asset market cap, following the launch of its Cardano (ADA), Chainlink (LINK) and Stellar (XLM) products.

Bitcoin Price Annual Forecast: BTC holds long-term bullish structure heading into 2026

Bitcoin (BTC) is wrapping up 2025 as one of its most eventful years, defined by unprecedented institutional participation, major regulatory developments, and extreme price volatility.

Bitcoin: Another month of losses, and it’s been five

Bitcoin (BTC) price is stabilizing around $68,000 at the time of writing on Friday, but the Crypto King is poised to close February on a fragile footing, marking its fifth consecutive month of losses since October and a rare start to the year with back-to-back monthly corrections.