Polkadot Price Prediction: DOT technicals spell doom amid a 40% colossal breakdown
- A descending triangle pattern on the 4-hour chart points at a 40% downswing to $18
- The 100 SMA has been lost as support, adding credence to the bearish picture.
- Polkadot must close the day above $30 to avoid potentially massive losses.

Polkadot is on the verge of another breakdown despite the freefall from the new all-time highs around $42. The support at $30 has been tested twice, leading to a bearish technical pattern. The least resistance path is downward based on the short-term technical picture.
Polkadot is extremely vulnerable to losses
DOT is trading at $29 at the time of writing. A couple of support areas have been lost, including the 100 Simple Moving Average (SMA) and the descending triangle’s x-axis. The pattern is bearish and comes into play amid a downtrend continuation. Two or more equal lows form the x-axis, and two or more consecutive declining peaks create the hypotenuse. These two lines converge to form the triangle.
A breakout is expected to occur below the x-axis for the triangle to qualify as a continuation pattern. As the pattern forms, trading volume diminishes but expands as soon as the price breaks below the horizontal line. The breakout from the triangle has an exact target measured from the widest distance of the pattern.
Meanwhile, Polkadot appears to be validating the breakout after sliding below the horizontal line. Note that broken support areas often flip into resistance zones. Trading volume is projected to rise as DOT gets ready for a 40% move to $18.
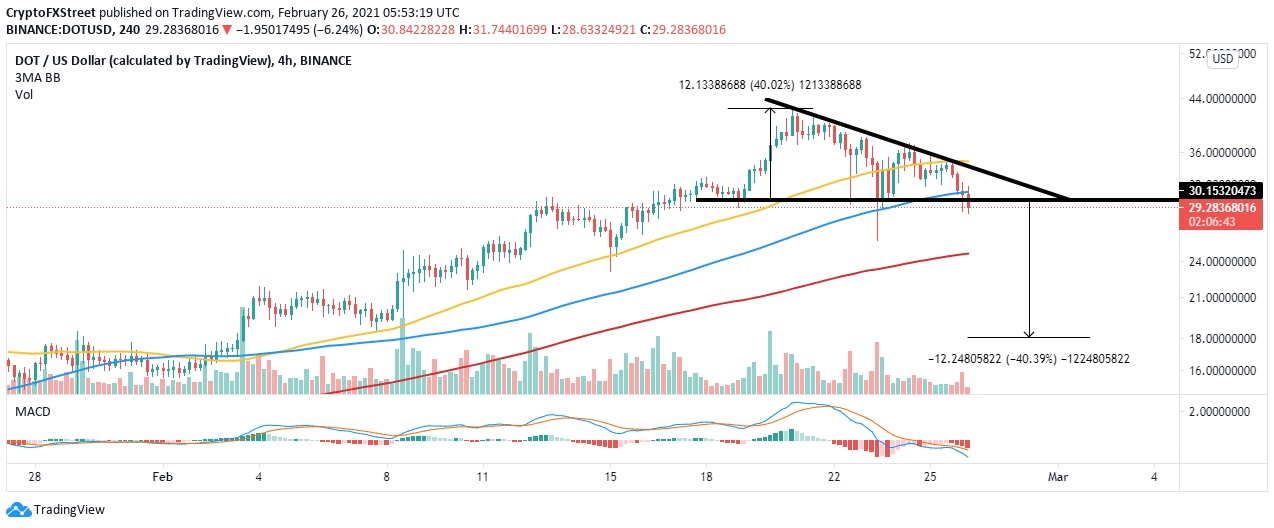
DOT/USD 4-hour chart
The same 4-hour chart highlights an extremely bearish Moving Average Convergence Divergence (MACD). Besides sliding into the negative territory, the MACD line (blue) increases the divergence beneath the signal line. The pattern shows that Polkadot is still in a sell zone, and therefore, further declines are anticipated.
The 12-hour SuperTrend indicator has recently flipped bearish, hinting at the beginning of a correction. DOT is likely to remain under the influence of the sellers until the indicator turns bullish again. Traders use this indicator to predict long-term downtrends and uptrends. When the impulse turns red and forms a line above the price, a bearish narrative comes into play.
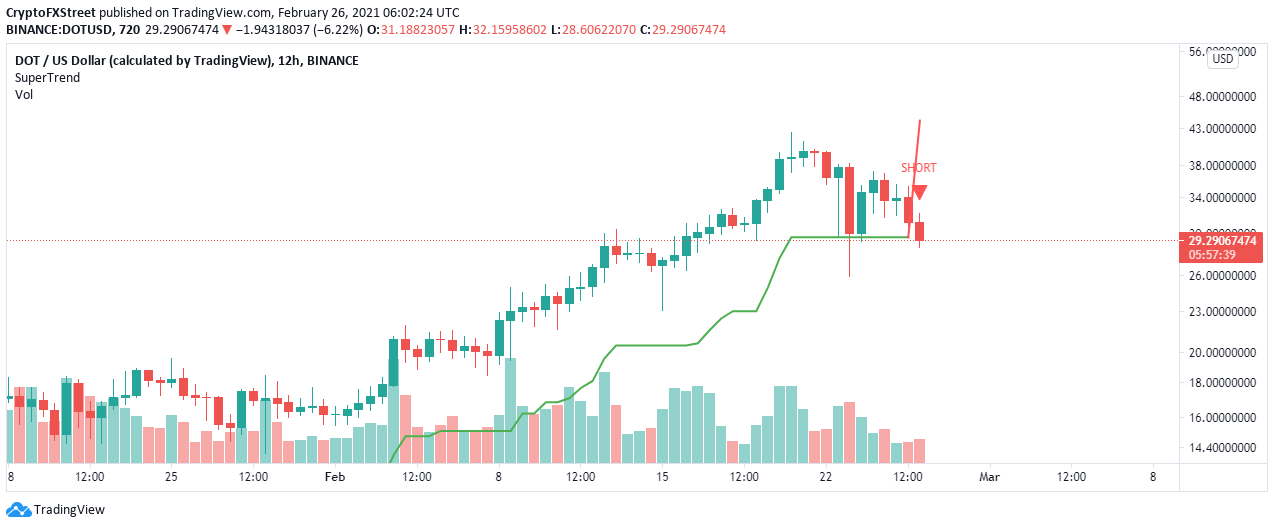
DOT/USD 12-hour chart
Looking at the other side of the picture
On the other hand, the massive potential breakdown may be avoided if Polkadot manages to reclaim the position within the triangle. Besides, a daily close above $30 could encourage more bulls to join the market. Simultaneously, buyers must focus on jumping above the 100 SMA to bring Polkadot out of the woods.
Author

John Isige
FXStreet
John Isige is a seasoned cryptocurrency journalist and markets analyst committed to delivering high-quality, actionable insights tailored to traders, investors, and crypto enthusiasts. He enjoys deep dives into emerging Web3 tren


