Polkadot price eyes 30% upswing as DOT consolidation reaches inflection point
- Polkadot price coils up below the 50-day SMA for nearly four months, hinting at a breakout.
- A bounce off the $10.37 to $15.66 demand zone will be the key to triggering a 30% move to $22.23.
- A daily candlestick close below $10.37 will invalidate the bullish thesis for DOT.

Polkadot price has been on a constant downtrend for roughly four months, and the 50-day SMA has played a crucial role in preventing DOT from rising. As a result, DOT seems to have begun coiling up between these two barriers.
Polkadot price to breakout soon
Polkadot price faced five rejections at the hands of the 50-day Simple Moving Average (SMA) over the past two months or so. The failed rallies bounced off the stable demand zone, extending from $10.37 to $15.66, wrestling in a tight consolidation lately.
As Polkadot price continues to coil up, the pent-up pressure will most likely lead to a breakout that pushes DOT to shatter the 50-day SMA and make a run for the immediate resistance barrier at $22.23. This move would constitute a 30% ascent from the current position - $17.23 and is likely where DOT will form a local top.
In a highly bullish case, there is a chance for bulls to extend the run-up to $24.63, which will likely be a point where the 100-day SMA will coincide, making it a tough level to crack.
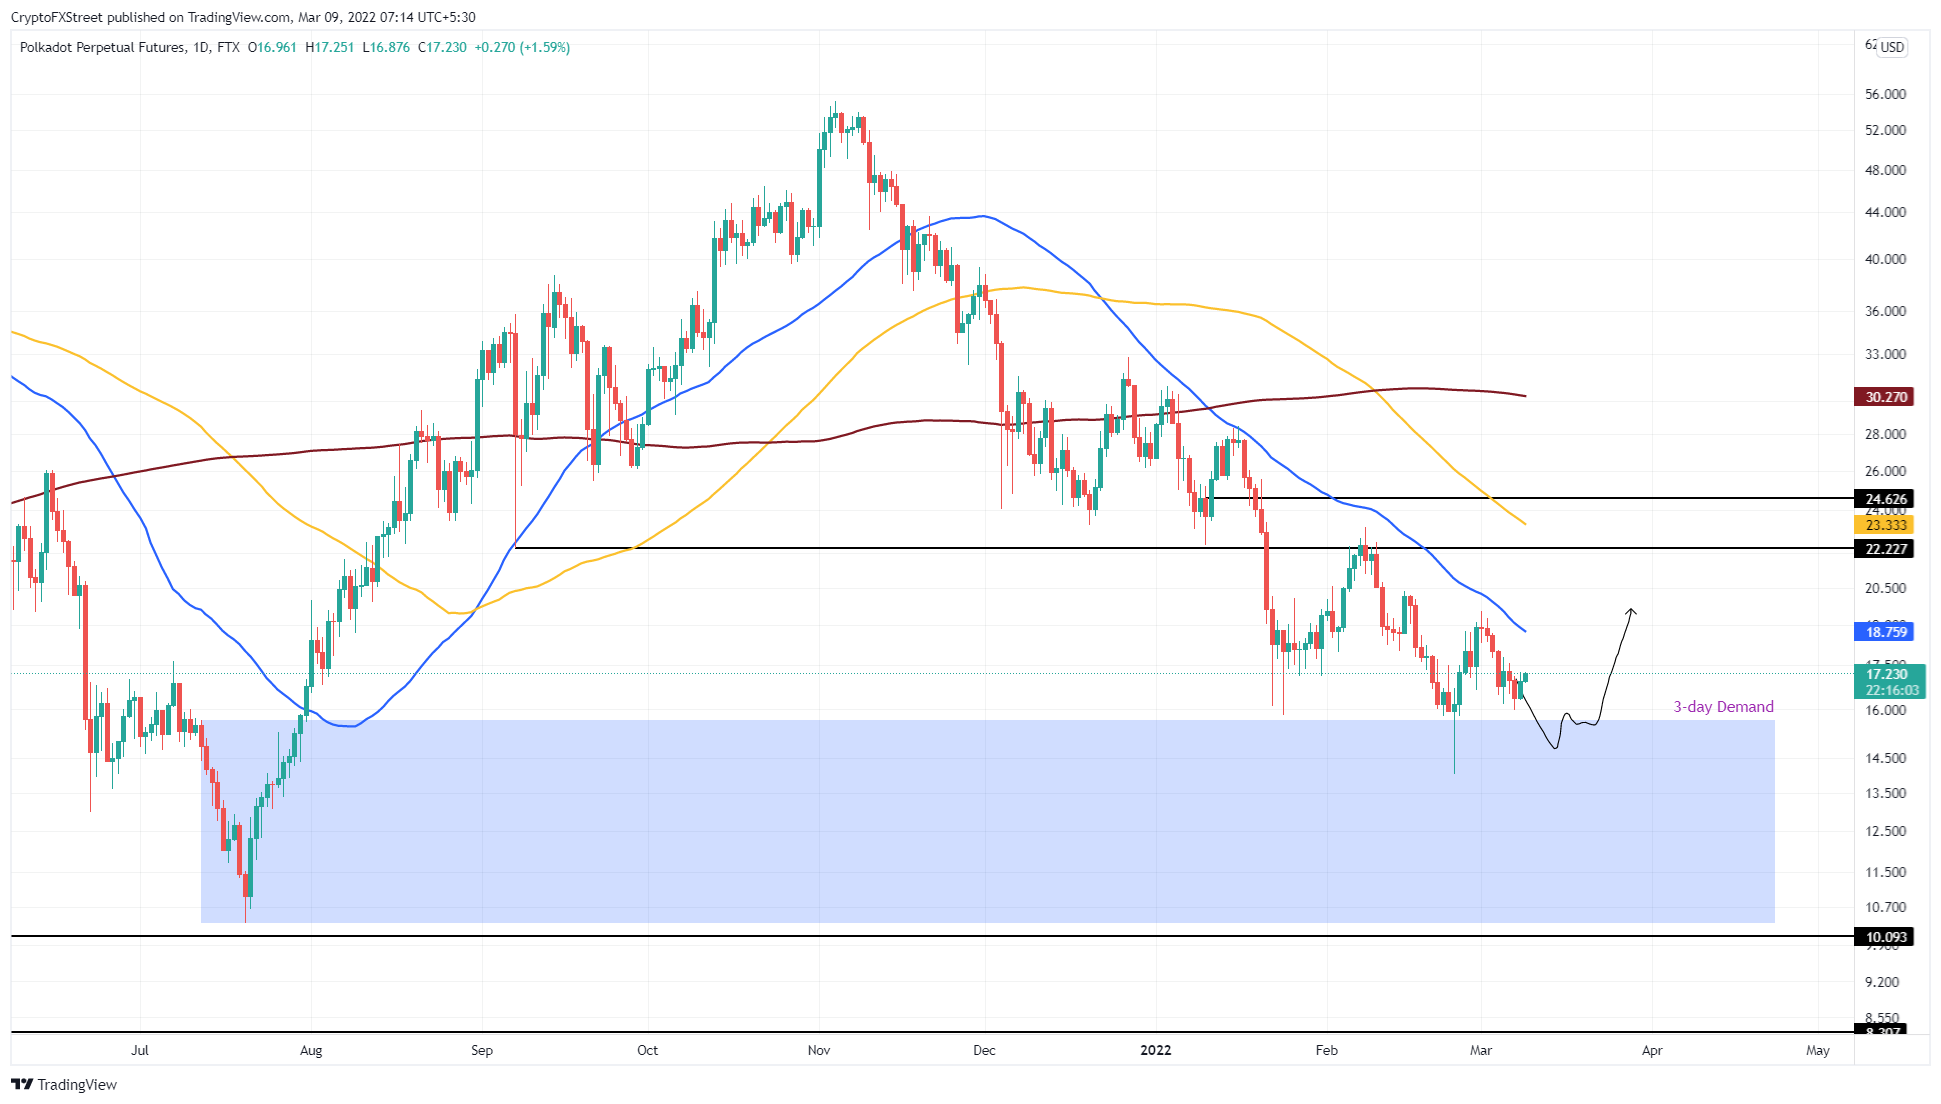
DOT/USDT 1-day chart
On the other hand, if Polkadot price fails to move past the 50-day SMA, it will reveal a weakness among buyers and will likely knock DOT lower. As Polkadot price explores inside the three-day demand zone, extending from $10.37 to $22.23, bulls have another chance at a comeback.
However, a daily candlestick close below $10.37 will invalidate the bullish thesis for DOT.
Author

Akash Girimath
FXStreet
Akash Girimath is a Mechanical Engineer interested in the chaos of the financial markets. Trying to make sense of this convoluted yet fascinating space, he switched his engineering job to become a crypto reporter and analyst.