Polkadot price eyes 25% rally, while DOT remains subdued by 50-day SMA
- Polkadot price might be open for a quick run-up as it approaches the $10.37 to $15.66 demand zone.
- A bounce off this barrier could trigger a 25% ascent to $19.75 and might extend to $20.
- If DOT produces a daily candlestick close below $10.37, it will invalidate the bullish thesis.

Polkadot price has been in a steady downtrend since November 2021 and shown no signs of a turnaround. Now, however, there are glimmers of hope for investors as DOT meanders close to a stable support level.
Polkadot price attempts to restart upswing
Polkadot price has crashed 74% from its all-time high and is currently hovering above a three-day demand zone, extending from $10.37 to $15.66. The recent downswing seems to be due to the presence of the 50-day Simple Moving Average (SMA).
Since December 27, 2021, every minor uptrend of Polkadot price faced rejection at the hands of the 50-day SMA. The most recent rally reversed after nearing the same hurdle on March 1. The resulting retracement will likely push DOT to retest the said demand zone.
A bounce off this barrier will be vital in triggering an uptrend for Polkadot price. Interested investors can open a long position at $15.66 and look to cover at around the 50-day SMA again, at $19.75. Market participants should note that, in some cases, DOT might extend this leg to retest $20.
In a highly bullish case, DOT might even make a run at the $22.23 resistance barrier, bringing the total upswing from 25% to 41%.
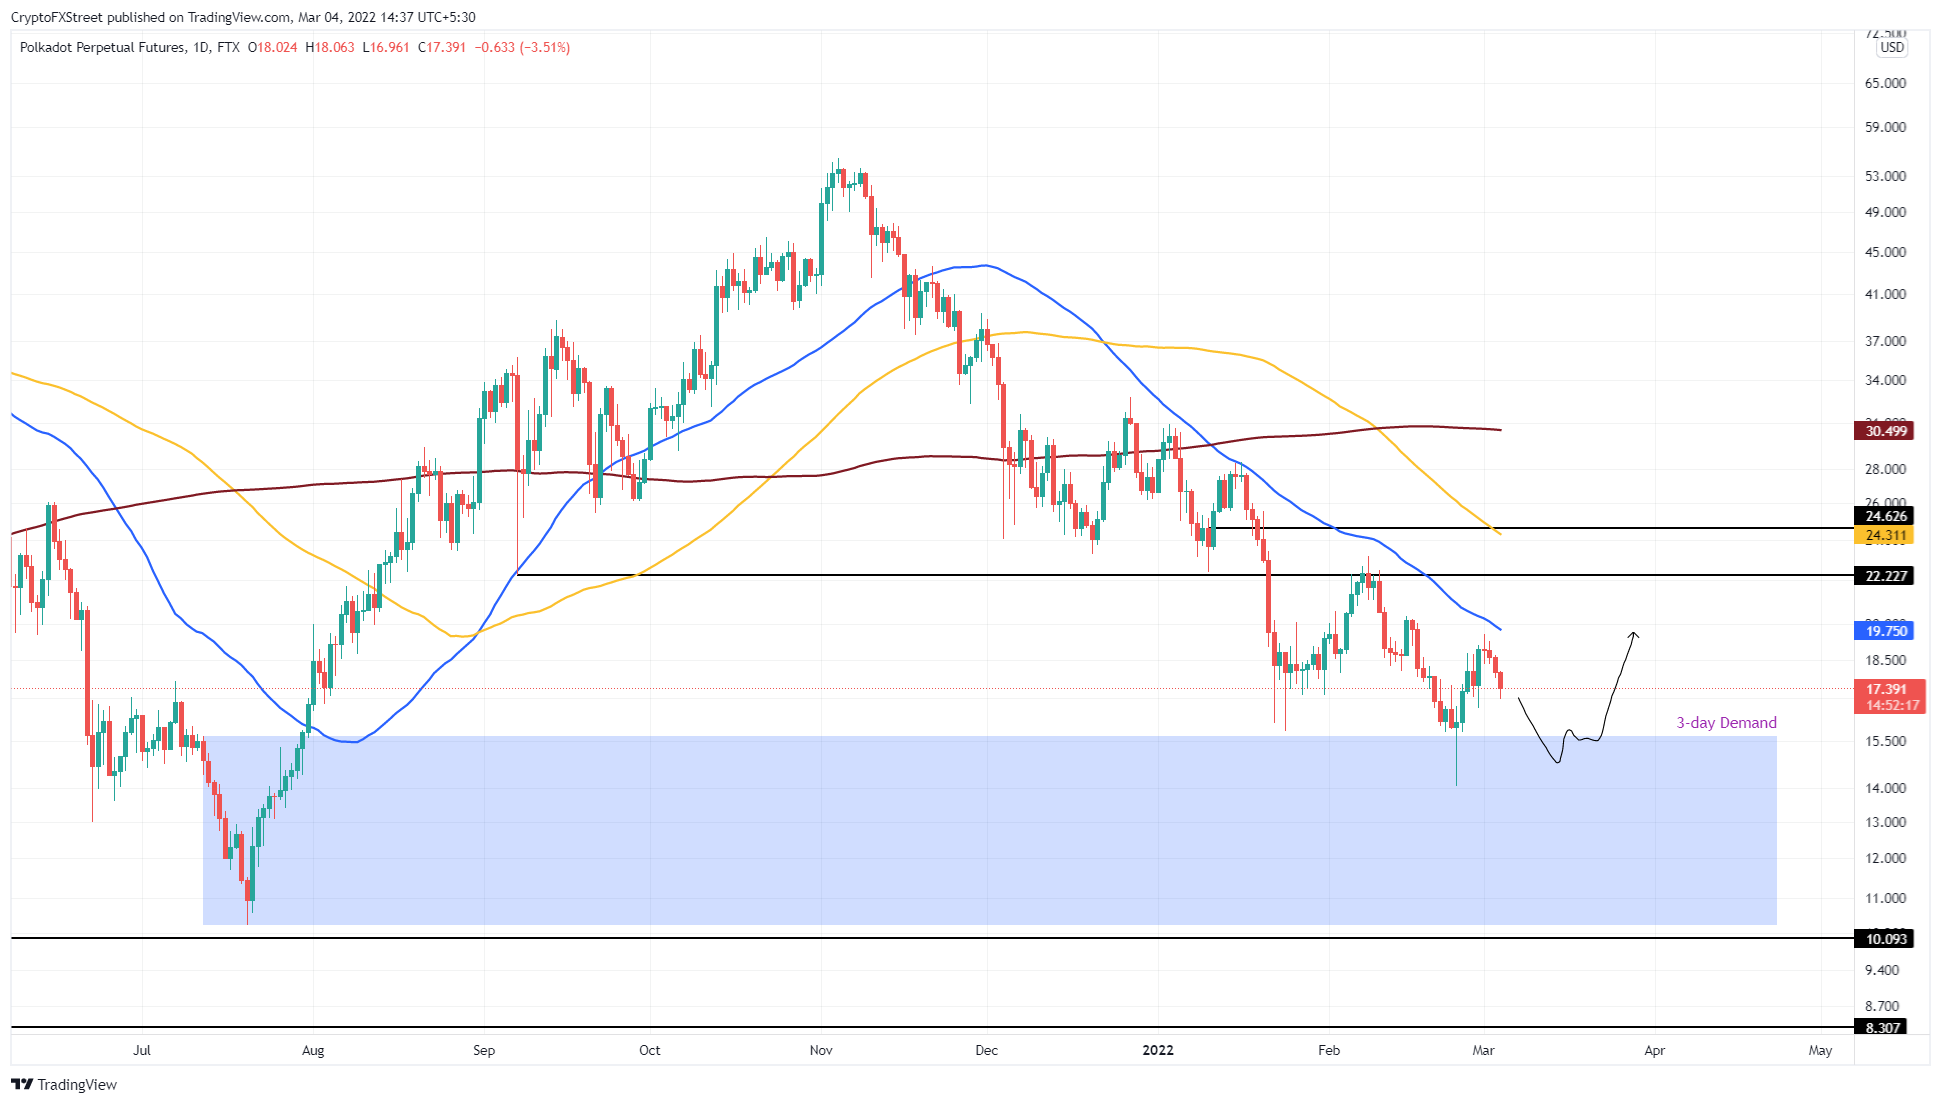
DOT/USDT 1-day chart
While things are looking up for the Polkadot price, a daily candlestick close below the $10.37 will breach the three-day demand zone and create a lower low. Such a move will invalidate the bullish thesis and open the path for bears to reign supreme.
In such a situation, Polkadot price might slide lower and retest the $10.09 support level or $8.31 barrier, from where buyers can attempt a fresh recovery.
Author

Akash Girimath
FXStreet
Akash Girimath is a Mechanical Engineer interested in the chaos of the financial markets. Trying to make sense of this convoluted yet fascinating space, he switched his engineering job to become a crypto reporter and analyst.


