Polkadot unable to remain above crucial support, bulls nervous as DOT could fall 10%

Polkadot unable to remain above crucial support, DOT to fall 10%
- Polkadot price continues to slide further down; the next support level is 10% below the open.
- DOT is primarily unchanged; the same reversal column exists from November 3, 2021.
- The threat of lower 2022 lows is now a possible outcome.
Polkadot price has retraced roughly 50% of the rally is experienced on Monday. Additionally, DOT has dropped below (and continues to drop) the Kijun-Sen. A test of the Tenkan-Sen as support is now in play.
Polkadot price may dip another 10% before testing the Tenkan-Sen as support
Polkadot price is at risk of terminating a new uptrend that it has attempted to build this week. Global concerns regarding commodity prices, Russian aggression and the invasion of Ukraine, and inflation have all contributed to a flight from risk-on assets.
The biggest concern weighing on DOT right now is its response after breaking below the Kijun-Sen. Although typically, the Kijun-Sen is a strong support level once an instrument closes above it, Polkadot could barely sustain a close above for more than two days.
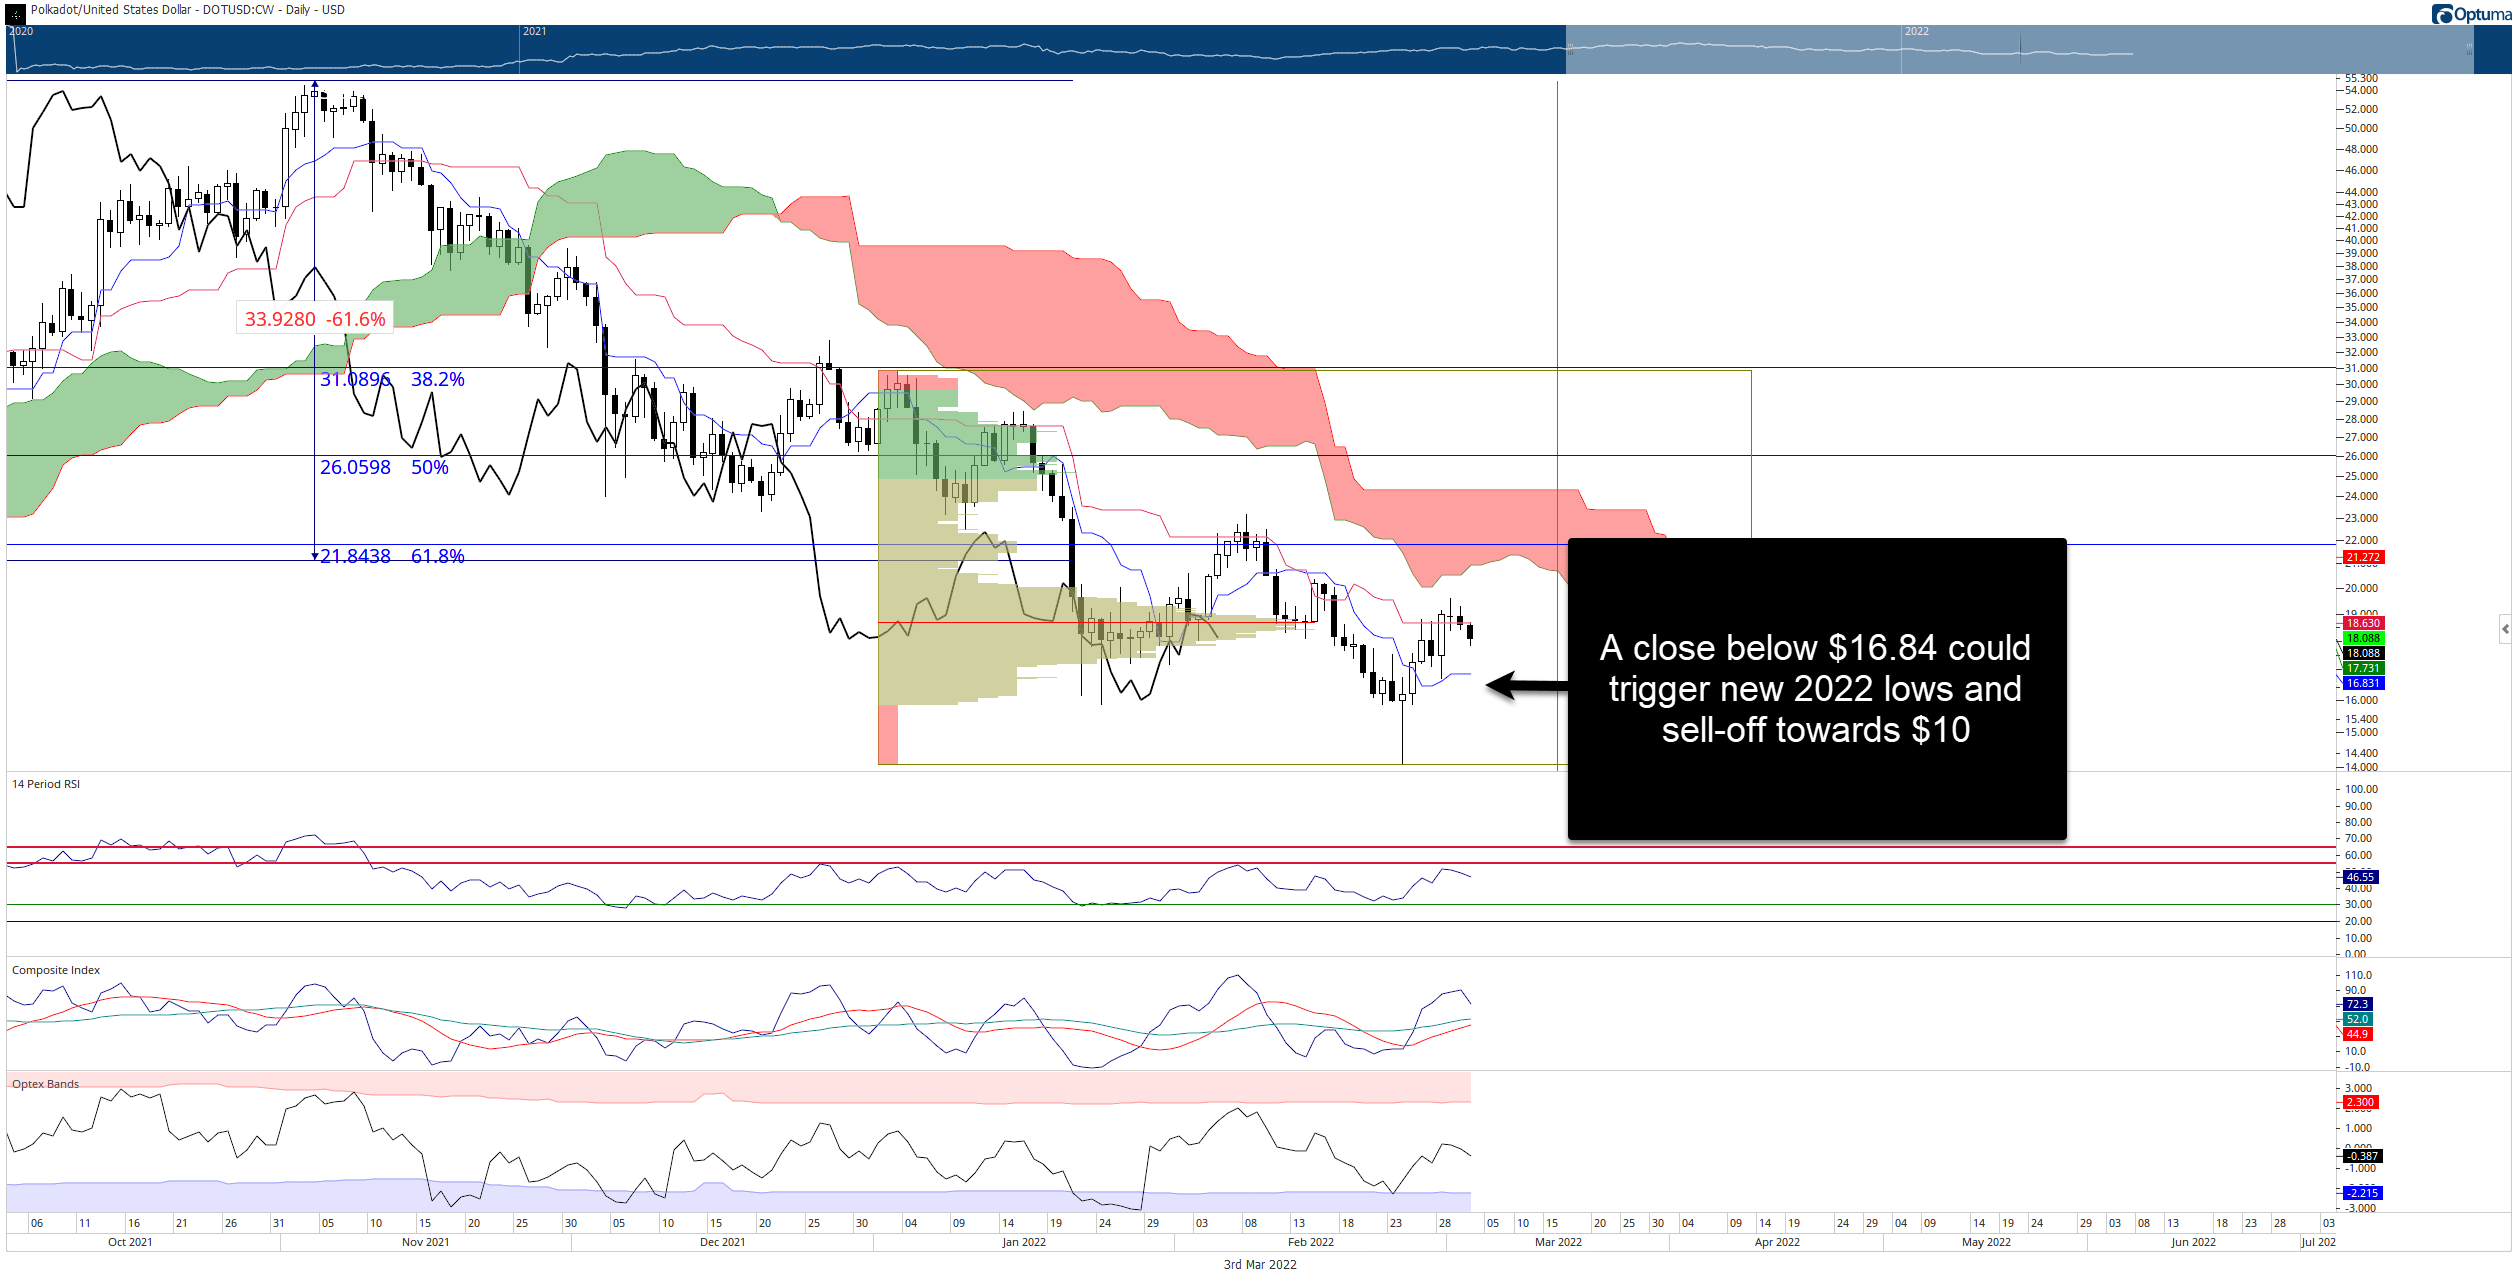
DOT/USD Daily Ichimoku Kinko Hyo Chart
The following support level within the Ichimoku system is the weakest– the Tenkan-Sen at $16.84. If DOT closes below the Tenkan-Sen, then nothing prevents Polkadot price from creating new 2022 lows and pushing down to the $10.00 level.
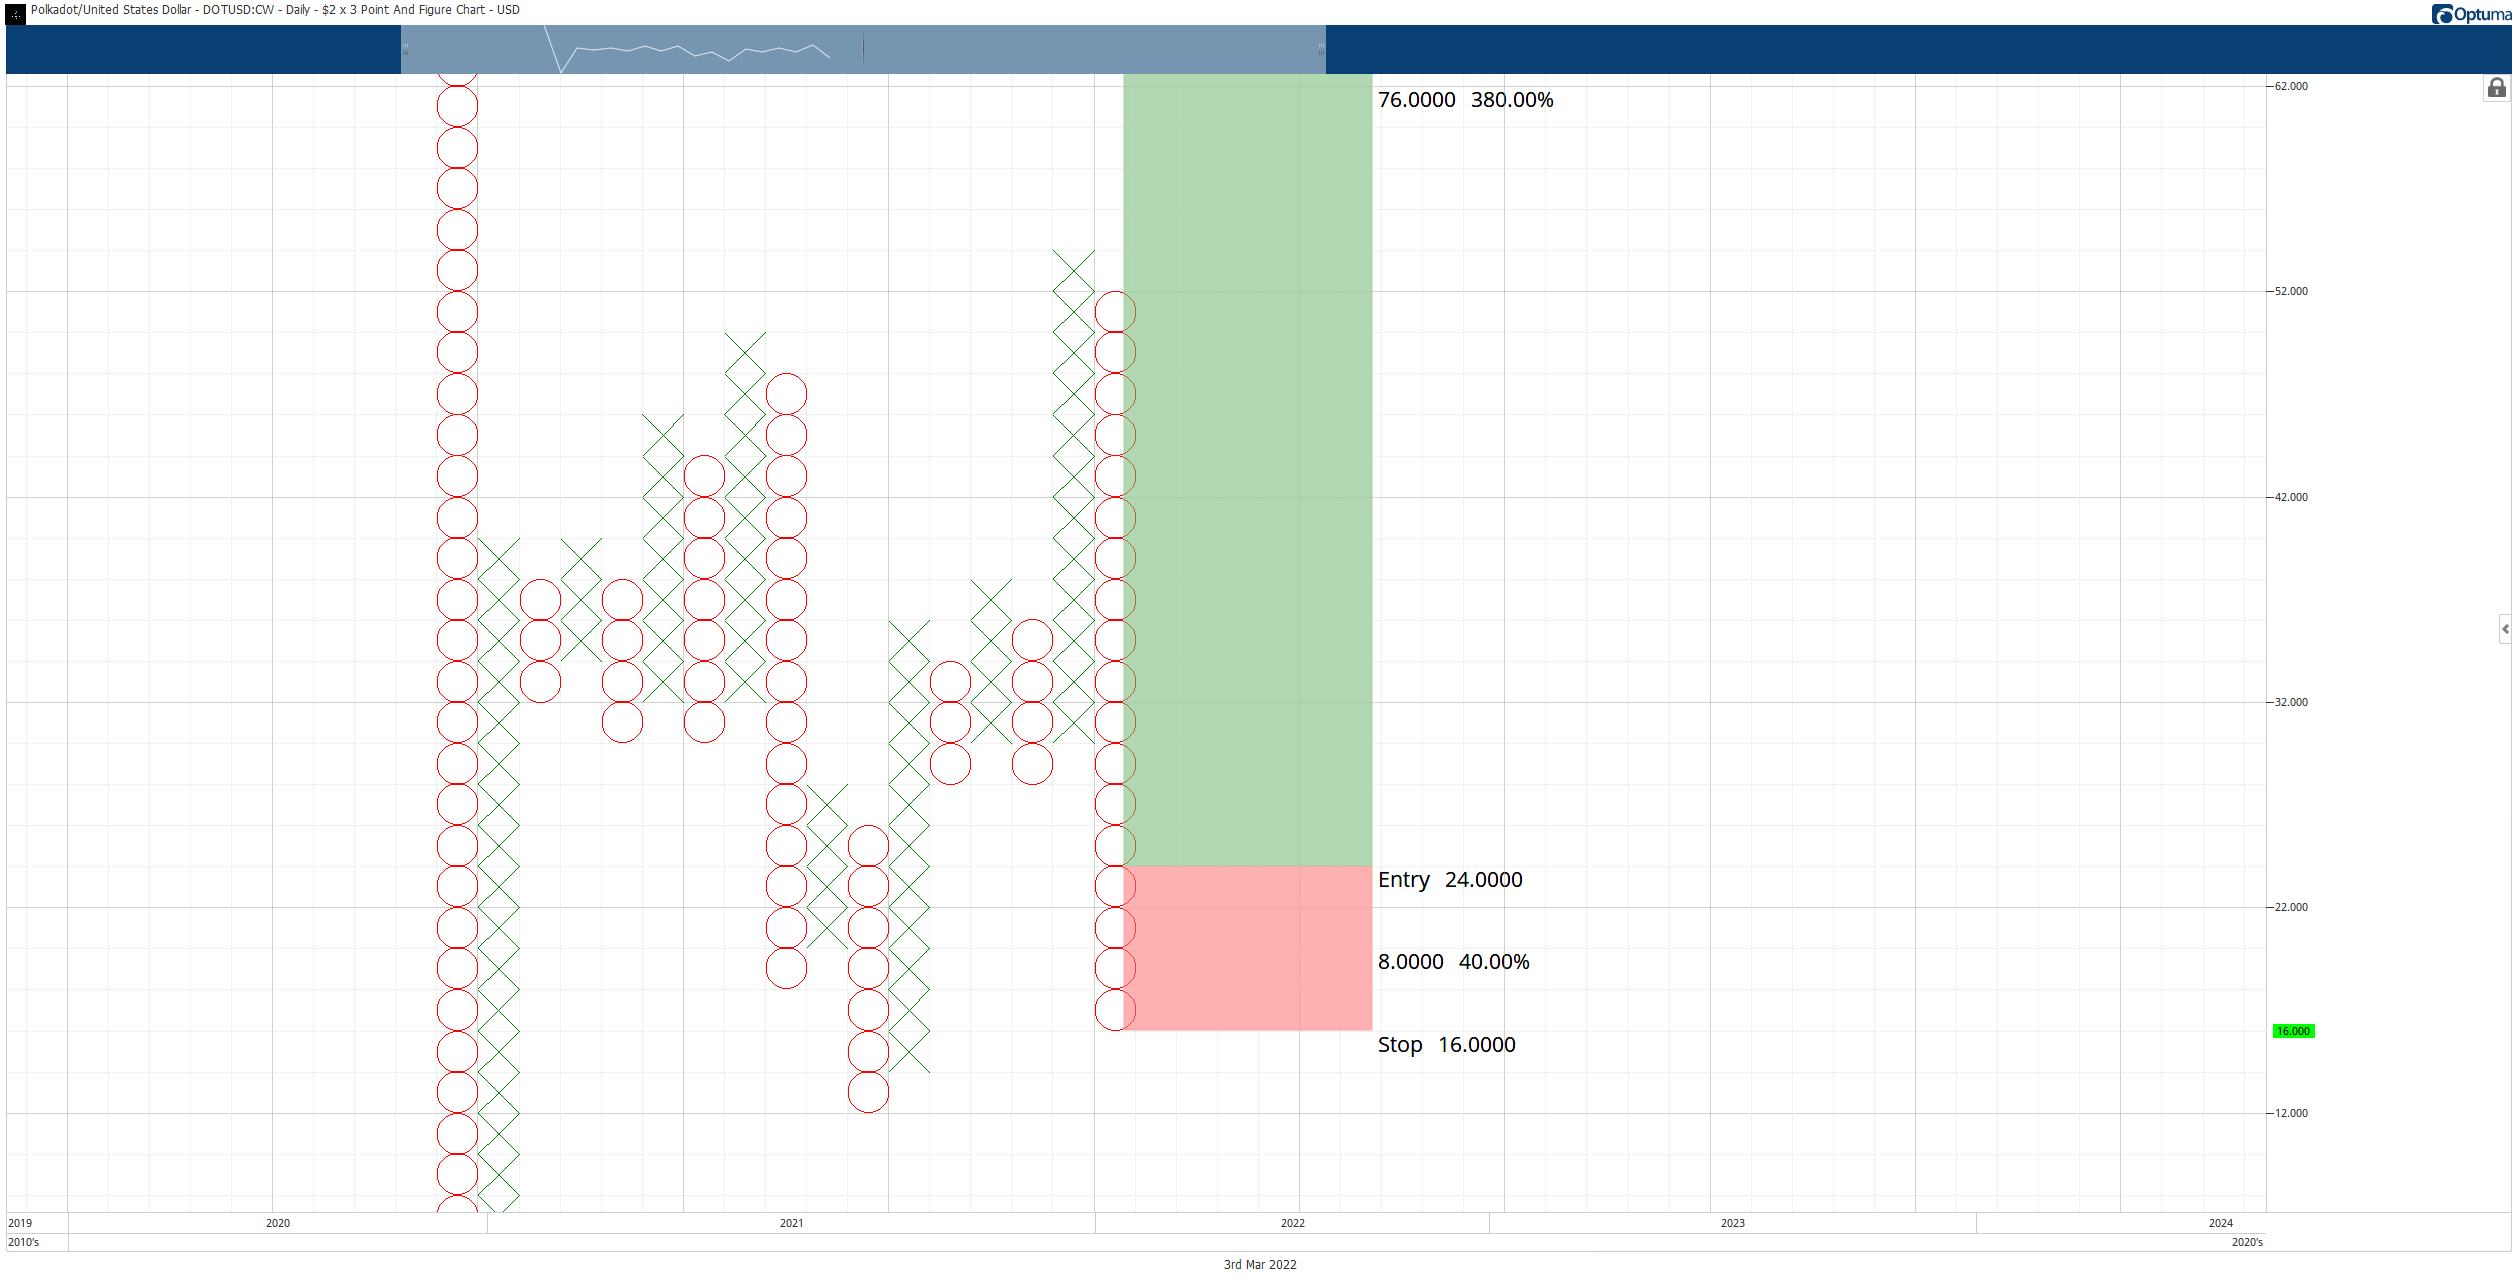
However, nothing has changed for Polkadot from a trading and pure price action perspective. Point and Figure traders wait for the first reversal column of Xs to appear, so how low DOT moves is inconsequential in the long run.
Polkadot price continues to have one of the longest-lasting Spike Patters on its Point and Figure chart of the entire cryptocurrency market. The beginning of the current O-column was first developed on November 3, 2021. Since November 3, 2021, DOT has yet to have a reversal column of Xs develop. Although no time factor exists on a Point and Figure chart, the length of time without a reversal is notable and considerable.
A Spike Pattern is any column with fifteen or more Xs or Os. It represents extremes and overdone movements. The entry off of a Spike Pattern is the three-box reversal. Compared to other patterns in Point and Figure analysis, the Spike Pattern requires active management and is a more aggressive entry.
The theoretical long entry remains buy stop order is at $24, a stop loss at $16, and a profit target at $100. The profit target is derived from the Vertical Profit Target Method in Point and Figure analysis and should not be viewed as a target likely to hit anytime soon.
DOT/USD $2.00/3-box Reversal Point and Figure Chart
Because it is a Spike Pattern, the low of the current O-column is not known. Therefore, if Polkadot price moves lower, the entry and four-box stop loss moves in tandem with price.
Given the resistance levels that have been discussed in prior analysis and on the existing Ichimoku charts, the $35 to $40 value area is likely to stop Polkadot’s initial rally from the entry.
Additionally, because it is a Spike Pattern, the low of the current O-column is not known. Therefore, if Polkadot price moves lower, the entry and four-box stop loss moves in tandem with price.
Downside risks could easily extend below the 2022 low towards the last high volume node from the 2021 Volume Profile at $10.00.
Author

Jonathan Morgan
Independent Analyst
Jonathan has been working as an Independent future, forex, and cryptocurrency trader and analyst for 8 years. He also has been writing for the past 5 years.


