MATIC Price Forecast: Polygon rallies with authority, targets $2
- MATIC price tags significant Fibonacci extension level as it rallies over 30%.
- Topside trend line offered no resistance today.
- Accumulation/distribution profile continues to favor the buyers.

MATIC price overcame two days of indecision to generate the best one-day rally since April 27. As long as Polygon stays above the topside trend line, the DeFi token will extend the impulsive rally through the weekend.
MATIC price showcasing the positive outlook for scalability solutions
Today’s 30% gain follows consecutive doji candlesticks, signifying a general equilibrium between Polygon buyers and sellers and a heightened level of indecision. The indecision could have resulted from the general volatility in the cryptocurrency market or the downward pressure being exerted by the topside trendline running through the April 30 high.
MATIC price has achieved a 230% gain since the breakout from a multi-week consolidation on April 26. It has been a highlight in the crypto space and confirms accelerating interest in Polygon scalability initiatives.
Earlier, MATIC price tested the 261.8% Fibonacci extension of the March-April consolidation at $1.53, raising the odds that Polygon will hold above the topside trend line at $1.21 and the May 12 high at $1.31 this week. More importantly, it sets the platform for higher prices in the days ahead.
In the short-term, the outstanding target is the confluence of the 261.8% Fibonacci extension of the recent May consolidation at $1.99 with $2.00. It would yield a 40% gain from the MATIC price at the time of trading.
If Polygon investors successfully surmount the notable resistance around $2.00, the next upside target for MATIC price is the 361.8% extension of the May consolidation at $3.01, giving investors a 100% gain from the price at the time of writing.
Working in favor of the Polygon bullish outlook is the muted overbought condition shown by the daily Relative Strength Index (RSI). It dictates higher prices in the near term, but it is important to note that the weekly RSI is very overbought and could undermine the rally to $3.00.
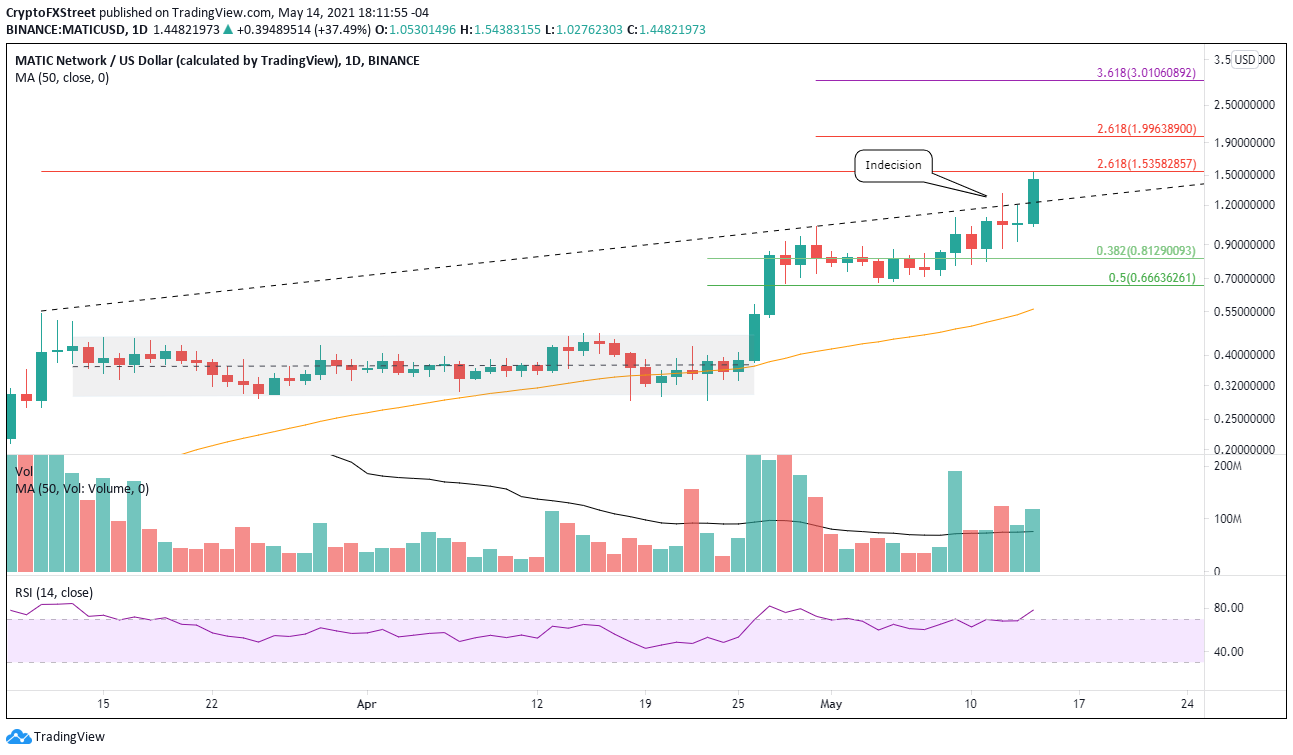
MATIC/USD daily chart
A failure this week to remain above $1.31 will unravel the bullish thesis, indicating that the rally this month has come to finalization and that a deeper corrective process, whether in time or price, has overtaken MATIC price.
Author

Sheldon McIntyre, CMT
Independent Analyst
Sheldon has 24 years of investment experience holding various positions in companies based in the United States and Chile. His core competencies include BRIC and G-10 equity markets, swing and position trading and technical analysis.



