MATIC Price Prediction: Polygon primed for a 25% rally
- MATIC price is in the final stages of composing a new base.
- Low volume correction is a prelude to a new opportunity.
- IOMAP model suggests MATIC price is facing stiff resistance near current level.

MATIC price enjoyed an impressive rally of over 100% following a multi-week consolidation in March and April but has since drifted lower. Still, the recent price action is revealing a bullish pattern that targets a double-digit gain moving forward.
MATIC price maintains constructive tone
MATIC price corrected almost 30% from the April 30 high to the May 4 low, releasing the overbought condition that resulted from the tremendous rally in late April. As a result of the correction, Polygon may be forming an inverse head-and-shoulders pattern on the intra-day charts. Some time is still needed to finalize the right shoulder, but the symmetry of the pattern and the declining neckline are aligned with a bullish resolution.
The measured move target of the pattern is $1.03 from the current position of the neckline, representing a gain of 24%. In the path of the target is the 78.6% Fibonacci retracement of the May decline at $0.88, followed by the April 30 high at $0.95 and the always tricky round number of $1.00.
An acceleration in the rally and elevated volume could catapult MATIC price to the 161.8% extension of the May correction at $1.15.
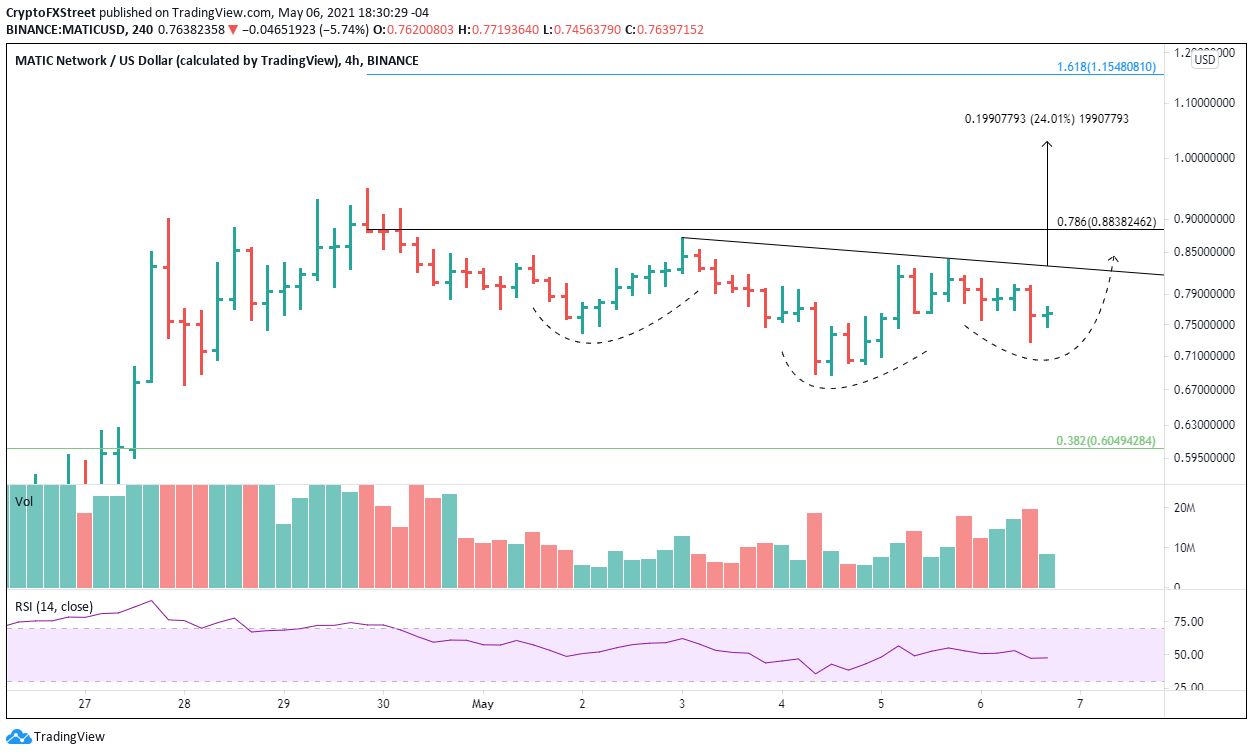
MATIC/USD 4-hour chart
If MATIC price falls below $0.72, the inverse head-and-shoulders pattern will be voided. The first line of support is the April 4 low at $0.68 and then the 38.2% retracement of the late April rally at $0.60.
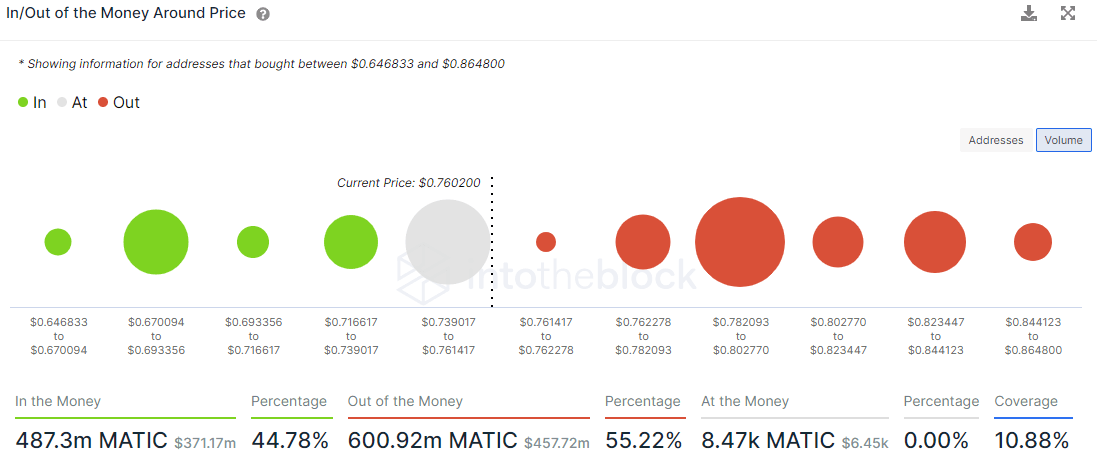
InTheBlock’s “In/Out of the Money Around Price” (IOMAP) model estimates that the $0.78-$80 price range will play a crucial role in determining whether MATIC price can reach the neckline and trigger the formation.
Currently, the model shows 3.85k addresses owning 324.55 million MATIC, by far the most significant price cluster.
On the downside, there is minimal support down to $0.64.
ETC IOMAP model
That said, if this range of resistance proves challenging, it will tilt the outlook to neutral, and a decline below right shoulder low at $0.72 will advance the need for heightened caution due to the marginal support below, as highlighted by the IOMAP model.
Author

Sheldon McIntyre, CMT
Independent Analyst
Sheldon has 24 years of investment experience holding various positions in companies based in the United States and Chile. His core competencies include BRIC and G-10 equity markets, swing and position trading and technical analysis.


