MATIC explodes as Polygon price sees whale-size inflow underpinning demand
- Polygon price is on a tear with no signs of slowing down.
- MATIC, however, is starting to look like a house of cards and could see headwinds blow it away soon.
- Traders need to be aware of what is driving price action to grasp the risks that come with it.

Polygon (MATIC) price is set to close the week with small gains, where the profit mounted up to 11% at one point. Unfortunately, bulls had to give up and give back some gains as several headwinds and risk events were nibbling at the profit from the bulls. Nonetheless, another weekly gain is set to be booked, but some warnings must be issued as a collapse is set to happen.
Polygon price textbook pump-and-dump?
Polygon price could be at risk if trading in another very know and simple trade setup that not fits the sell-the-rumor-buy-the-fact or vice versa plan but is called the pump-and-dump trade. The idea is simple: run the price action of an asset up very quickly and high and start selling your position once you see other traders chasing the price action. Once the whale is out of the price, bulls will have bought very high and expensive levels and will never see their position turn into profit as a collapse is imminent.
MATIC fits that description as on-chain metrics point to a massive whale-size switch from Bitcoin into MATIC for 4.56bn $MATIC. Expect with price action being ramped up, the speculator or group of speculators will sell in small increments to not flood the market with sell orders and book massive gains as traders chase this rally out of Fear of Missing Out (FOMO). A 20% decline could happen as $1.09 cannot catch the falling knife move, and the 55-day Simple Moving Average will be able to do the trick.
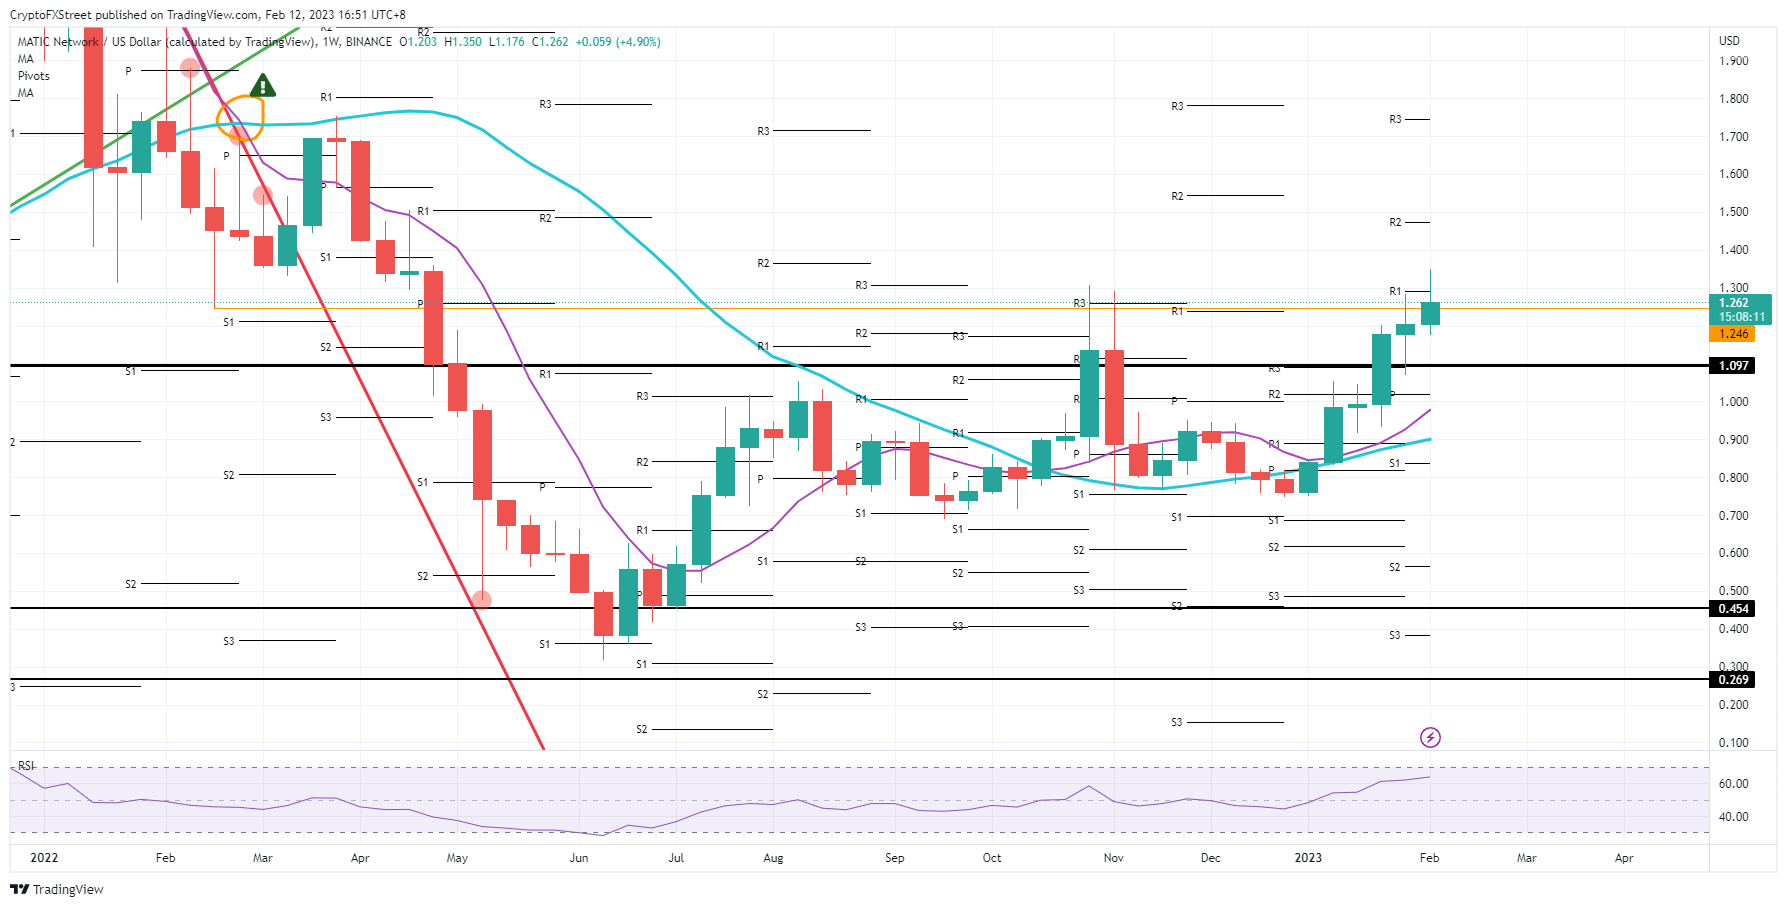
MATIC/USD weekly chart
Should the whale move be right and with the good intentions of staying in MATIC, expect to see a grind higher with other traders coming in and jacking up price action even further. The R2 resistance level at $1.5 looks good for a profit-taking level and looks for a short fade and opportunity for bulls to turn R2 into support; if that happens, $1.80 is in the card with 47% gains in each bull's trading book.
Author

Filip Lagaart
FXStreet
Filip Lagaart is a former sales/trader with over 15 years of financial markets expertise under its belt.


