Litecoin Price Analysis: LTC boom-bust cycle favors the patience narrative
- Litecoin price beginning the day with a breakout from a minor inverse head-and-shoulders pattern.
- 200-day simple moving average (SMA) serving as support and resistance over the past week.
- LTC on pace to close May with a 30% decline after briefly testing the 2017 high earlier in the month.

Litecoin price is currently shaping an indecisive pattern like most cryptocurrencies while finding support around the strategically important 200-day SMA. The outlook for the peer-to-peer coin remains neutral until a better entry point can be observed on the long-term LTC charts.
Litecoin price searches for catalyst against a backdrop of uncertainty
Litecoin price declined 70% from the May 10 high to the May 23 low, including a 36% decline on May 19 and a 50% decline for the week. The daily fall was one of the largest, going back to 2017, and the weekly LTC decline was by far the largest, taking the daily Relative Strength Index (RSI) to an oversold reading for the first time since March 2020.
The historic LTC decline was prefaced by a growing bearish momentum divergence on the weekly chart. A bearish momentum divergence occurs when the RSI does not print a higher high along with the Litecoin price. It is a signal that the rally momentum is dissipating, and investors should be alert for an exit signal.
Today, Litecoin price is slowly breaking out from a minor inverse head-and-shoulders pattern on the four-hour chart. The measured move target is $208.17, representing a 17.4% gain from the neckline. The LTC target is just below the May 27 high of $208.98. It offers some clarification for the immediate price action, but it does not resolve the problem of an actionable longer-term base.
For now, investors should be prepared for more volatility around the 200-day SMA with brief attempts at overcoming the lower trend line of the longstanding ascending channel at $222.00, or potentially the 38.2% Fibonacci retracement of the May correction at $230.78. For tactical traders, it should be a profitable period.
If the underlying market gains traction, Litecoin price could reach the confluence of the 200 four-hour SMA at $265.41 and the 50% retracement at $265.75.
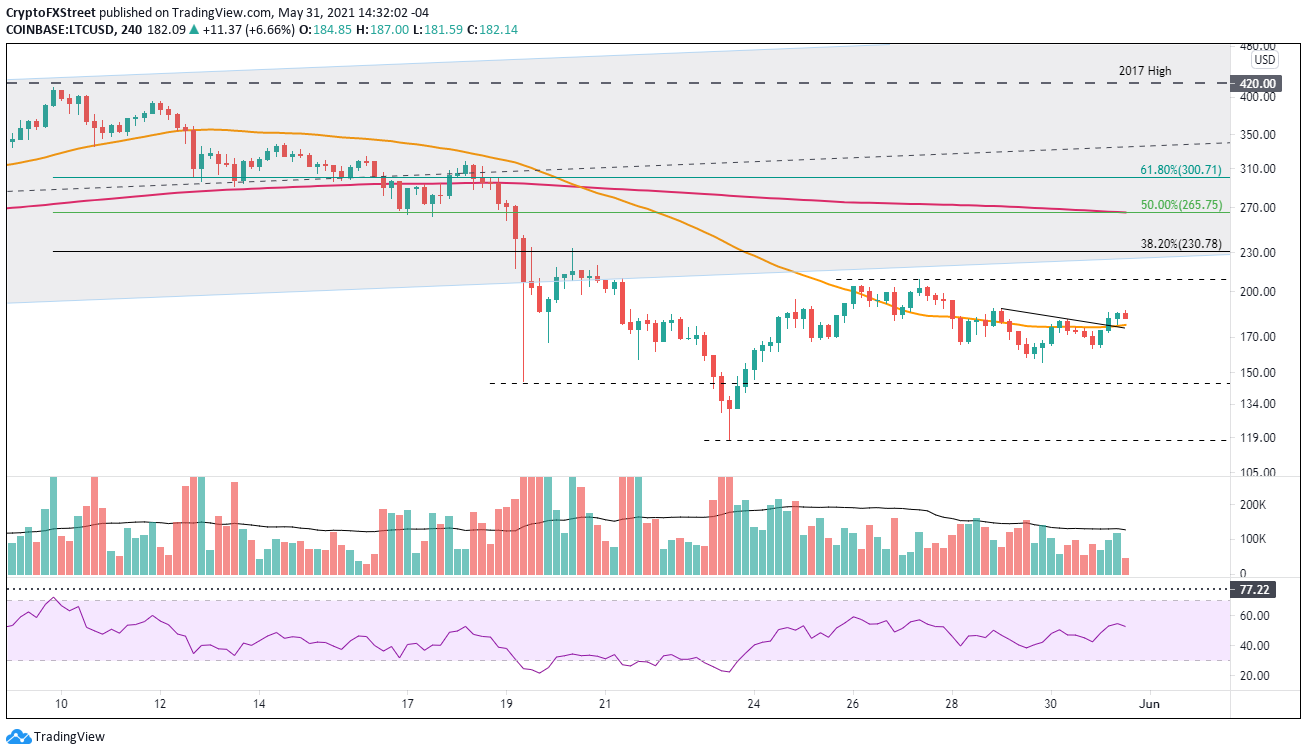
LTC/USD 4-hour chart
Downside support begins with the right shoulder low at $163.70, followed by the May 19 low at $145.26, and then the May 23 low at $117.58.
A cursory review of Litecoin price since the beginning of 2017 shows a digital asset that is a boom-bust investment, marked by a 10,00% rally in 2017, a 90% plunge into December 2018 and then a 550% rally followed by an 80% collapse, and finally the recent 1,500% advance. The 70% decline in May should not be a surprise, but it may not define the end until a constructive LTC base is formed on the longer duration charts. Moreover, investors can stop fantasizing about four-digit prices that dominated the recent bullish narrative heading into the 2017 high.
Author

Sheldon McIntyre, CMT
Independent Analyst
Sheldon has 24 years of investment experience holding various positions in companies based in the United States and Chile. His core competencies include BRIC and G-10 equity markets, swing and position trading and technical analysis.


