How can traders squeeze in more gains as Shiba Inu price teases a 42% rally
- Shiba Inu price is getting ready to climb to $0.00001743.
- Investors pay more attention to SHIB following a positive inflation report from the US.
- Shiba Inu price will face immense resistance at $0.000017, according to IntoTheBlock’s IOMAP.
Shiba Inu price positively reacted to the United States inflation report, forming a bullish candle on its daily chart. The second-largest meme coin brushed shoulders with $0.00001287 but pulled back to test support highlighted by the 100-day Simple Moving Average (SMA) at $0.00001170. SHIB later recoiled, to trade at $0.00001236 at the time of writing while preparing to make a gigantic move to $0.00001743.
US inflation drops for the first time in 4 months
The cryptocurrency market reacted positively to an inflation report released on Thursday. Following a record spike to 9.1%, inflation in the world’s biggest economy fell to 8.5%, dwarfing market watchers’ expectation of a 0.2% drop. Analysts considered the possibility of a drop, citing a significant downswing in gasoline prices in July.
As reported, Bitcoin price stretched the bullish leg above $24,000, where it almost tagged $25,000. Ethereum price advanced to $1,935, leaving the inflection point at $2,000 untested.
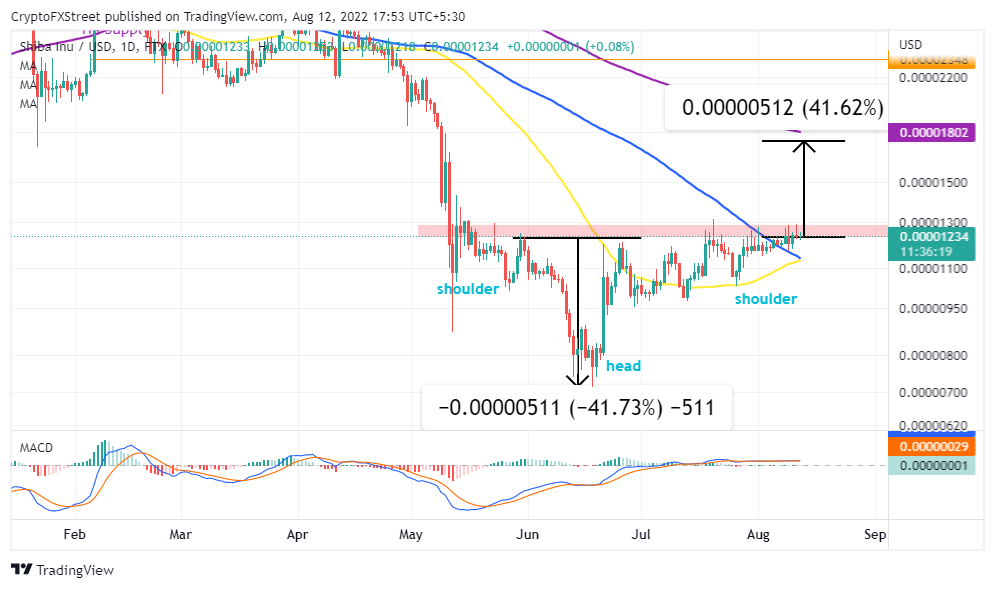
Shiba Inu price is ready to tap the inverse head-and-shoulders pattern
Shiba Inu price may continue outperforming its rivals like Dogecoin (DOGE) if a breakout presented by an inverse-head-and-shoulders (H&S) pattern confirms. Ideally, SHIB must make a clear break above the neckline resistance, as illustrated in the chart below.
SHIB/USD daily chart
The same daily chart shows the 50-day Simple Moving Average (SMA) crossing above the 100-day SMA. Although this pattern is not a golden cross, its occurrence is a bullish gesture – coupled with the impending H&S breakout; they would render the 42% target relatively conservative.
Adding credence to Shiba Inu price optimistic narrative is a buy signal from the Moving Average Convergence Divergence (MACD). The tail force on SHIB is bound to increase as the MACD moves above the mean line.
What’s delaying the Shiba Inu price breakout?
The region around the H&S pattern’s neckline has been highly contested since the crash in May. For SHIB to break free, it has to put this seller congestion in the rearview mirror. According to IntoTheBlock’s IOMAP model, traders should consider booking profits in the lower band of the subsequent resistance shown at $0.00001400. However, Shiba Inu price might have the potential to eat into the resistance at $0.00001700.
-637959092638790669.png)
Shiba Inu IOMAP metric
The most bullish traders have the liberty to let Shiba Inu exhaust the uptrend to $0.00002100. On the downside, weak support is highlighted by the IOMAP cohorts at $0.00001000. Declines will likely gain momentum to $0.00000700 if bears crack into the buyer congestion at $0.00001000.
Author

John Isige
FXStreet
John Isige is a seasoned cryptocurrency journalist and markets analyst committed to delivering high-quality, actionable insights tailored to traders, investors, and crypto enthusiasts. He enjoys deep dives into emerging Web3 tren


