Bitcoin price levels up for a 13.5% move amid dwindling exchange balance
- Bitcoin’s balance on exchanges drops to a four-year low, hinting at a bullish long-term outlook.
- Bitcoin price needs to break and keep above the 200-day SMA to affirm an impending move to $28,000.
- Bulls must defend the newly reclaimed $24,000 level to avert potential losses to $22,000.

Bitcoin price has struggled to find a solid footing during this crypto winter. Support above $24,000 is becoming elusive amid frequent pullbacks. However, its overall technical picture points to a smooth ride to $28,000. Bitcoin price will need support from micro and fundamental factors to keep the uptrend intact.
Bitcoin price regains momentum
Bitcoin price is hunting for a way out of the bear market, and one sign it is having some success is the falling amount of BTCs on exchanges. On-chain data by Glassnode elucidates an exchange balance currently around 2,377,195 BTC, down from 2,652,488 BTC on January 1, 2022.
Usually, a consistent drop in this metric suggests that investors prefer their coins in other wallets rather than on exchanges where they are more likely to be poised to sell them. It shows that prices will eventually turn around, which is a positive indicator for Bitcoin price.
-637958238466845166.png)
Bitcoin Balance On Exchanges
The Moving Average Convergence Divergence (MACD) on the 12-hour chart has reinforced the Bitcoin price move above $24,000. Traders can squeeze in more gains as long as the bullish divergence formed by the 12-day Exponential Moving Average (EMA) and the 26-day EMA stays in place.
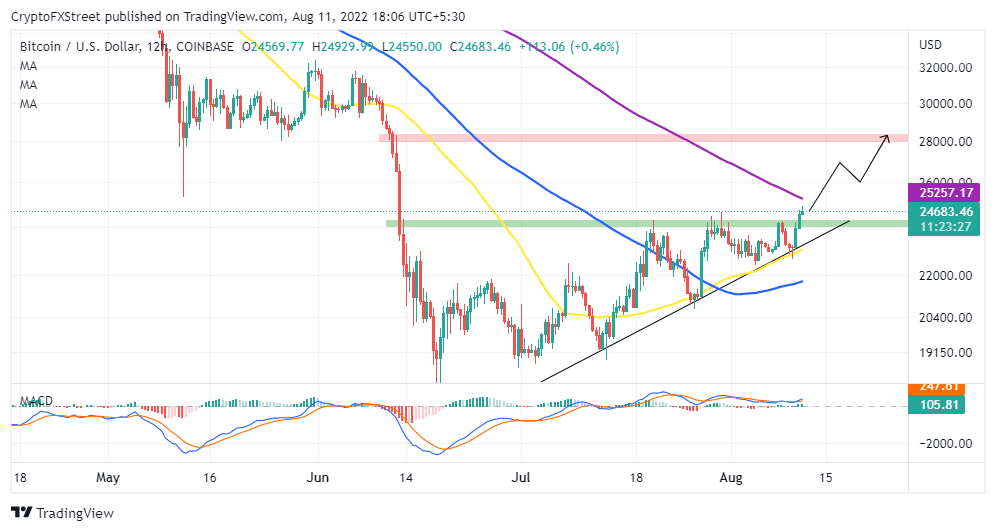
BTC/USD 12-hour chart
A break above the 200-day Simple Moving Average (SMA) at $25,257 will likely weaken the bears more, eliciting the fear of missing out (FOMO). If most of the buyers waiting on the sidelines heed the above buy signal, a breakout to $28,000 will be a matter of when.
It will be safer to book early profits at $25,257 if the uncertainty of the bear market is considered. However, bullish traders could wait till $26,000, which is an inflection point likely to determine the approach to $28,000.
On the flip side, a hefty buyer congestion zone is expected at $24,000. The ascending trend line will come in handy if declines soar. Fortifying this support is the 50-day SMA on the same 12-hour chart.
-637958237421255802.png)
Bitcoin IOMAP chart
Bitcoin price will likely settle for the path with the least resistance, and according to IntoTheBlock’s IOMAP on-chain model, that’s the one heading north. The chart below reveals the presence of minor seller concentration areas to $28,000. On the contrary, robust support zones are in line to cushion Bitcoin price from plunging below $24,000.
Author

John Isige
FXStreet
John Isige is a seasoned cryptocurrency journalist and markets analyst committed to delivering high-quality, actionable insights tailored to traders, investors, and crypto enthusiasts. He enjoys deep dives into emerging Web3 tren



