Here is why Shiba Inu price might double in the following days
- Shiba Inu price has been moving in a tight range for more than two weeks.
- The sideways movement combined with declining volume suggests that SHIB is due for a massive breakout move.
- The MACD indicator retreating red histogram bars and converging lines indicate an increase in short-term bullish momentum.

Shiba Inu price shows an extended consolidation after a massive flash crash caused by Ethereum creator Vitalik Buterin, after he pulled the SHIB liquidity from Uniswap. The dog-themed cryptocurrency is trading sideways, awaiting a trigger for a massive breakout move.
Shiba Inu price technicals point to a 100% upswing
Shiba Inu price dropped a whopping 83% to $0.00000654 from May 10 to May 19. This nosedive was triggered after Vitalik Buterin sold his gifted 2 trillion in SHIB, worth $40+ million on May 12.
The plummet caused some damage to the meme coin, but price action since this drop has developed a consolidation in a tight range. Interestingly, the volume for this sideways movement is declining, suggesting that Shiba Inu price is coiling up for a massive move higher.
Further supporting this rally is the Moving Average Convergence Divergence (MACD) indicator, which shows declining histograms indicating a decrease in short-term selling momentum.
Moreover, the short length moving average (12 MA) is heading higher, converging toward the slow length moving average (26 MA).
This technical setup reflects a bullish move waiting to happen.
If the 12 MA moves above the 26 MA, it will indicate a bullish crossover, confirming a shift in momentum toward the bulls.
If Shiba Inu price produces a decisive close above the 23.6% Fibonacci retracement level at $0.0000103, it will confirm the start of an uptrend. Such a move might trigger a 100% upswing that places SHIB at $0.0000203, coinciding with the 50% Fibonacci retracement level.
The 38.2% Fibonacci retracement level at $0.0000158 will play a crucial role in shaping the said bull rally.
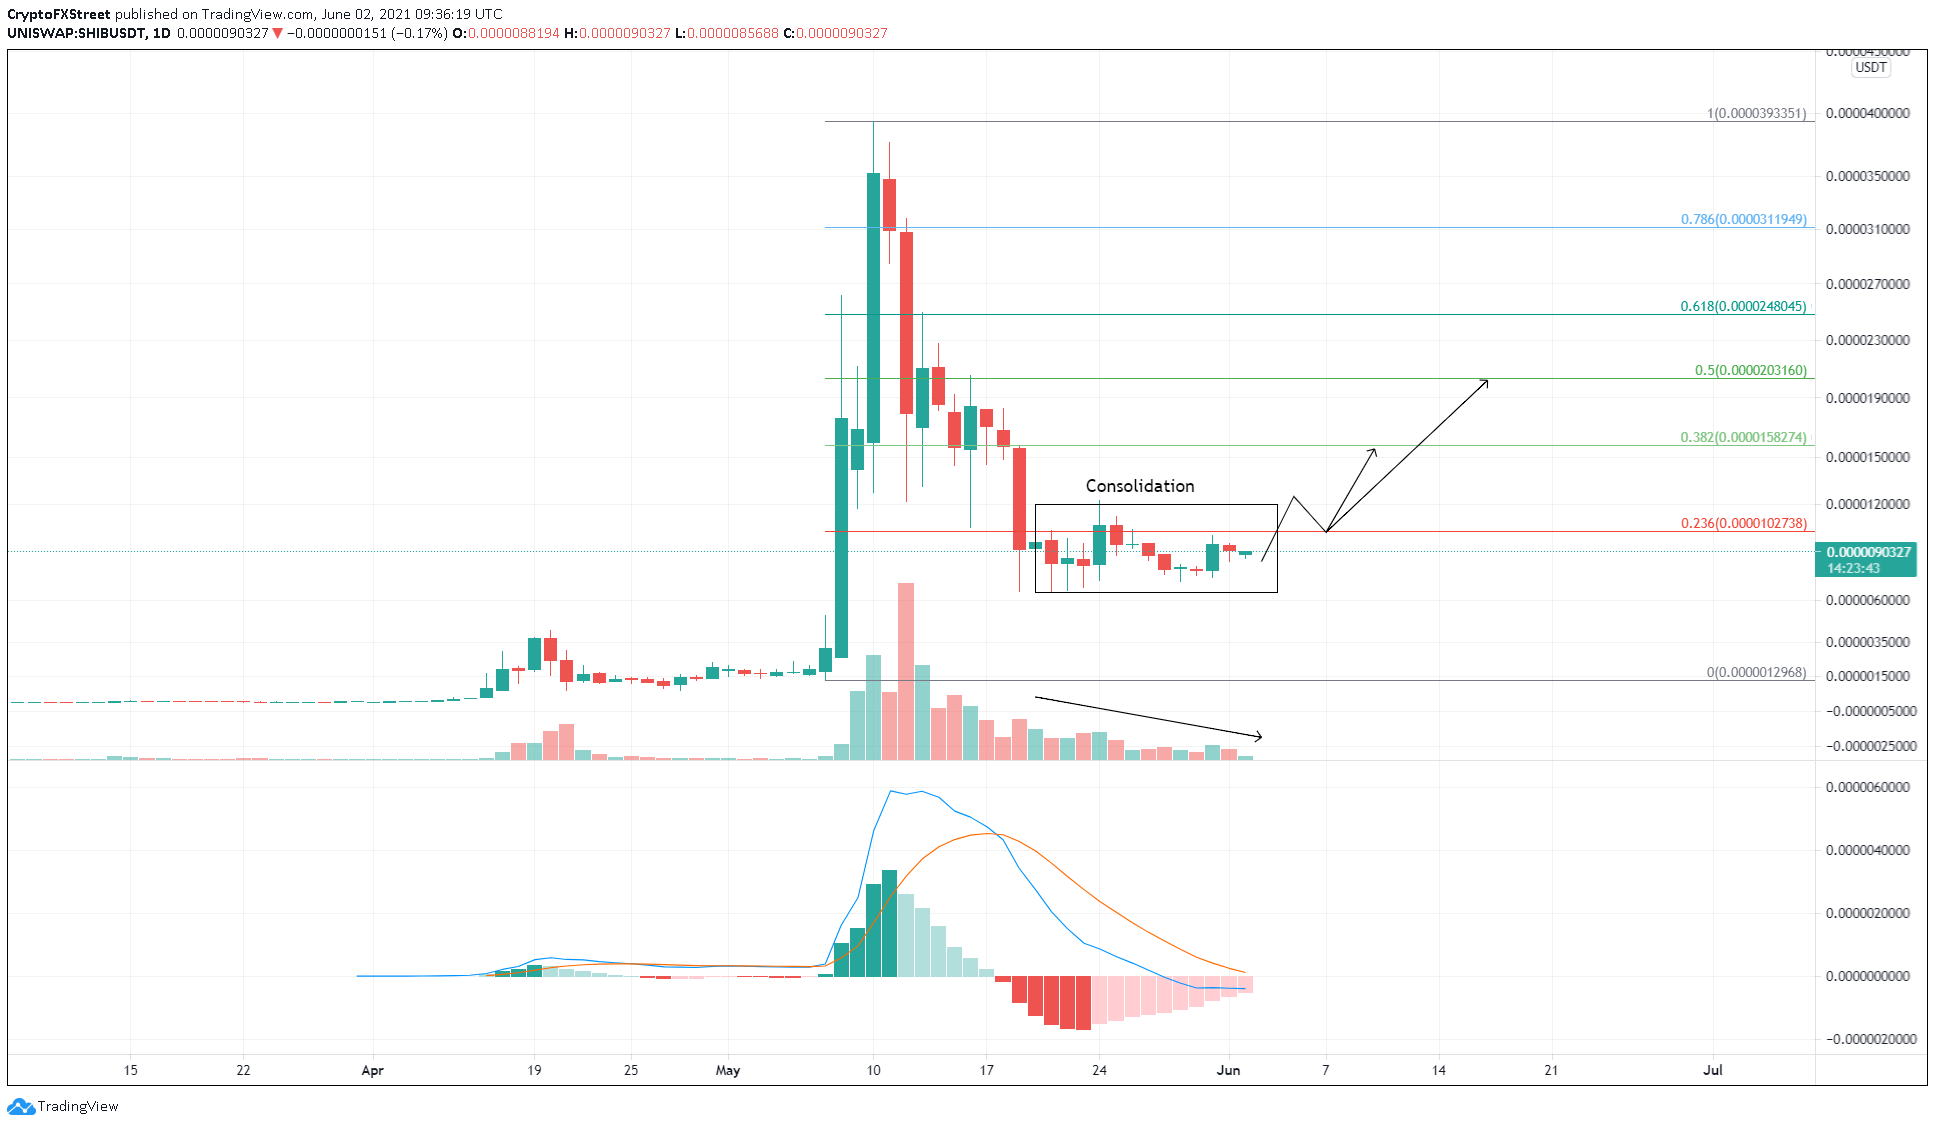
SHIB/USD 1-day chart
On-chain metrics indicate fearless whales on an accumulation spree
Whales holding more than 100,000 SHIB have been buying the meme coin despite the 83% drawdown from its peak. Since May 20, these large investors have increased from 390,000 to 435,000.
This 11.5% increase indicates that these market participants are optimistic about the price performance of Shiba Inu.
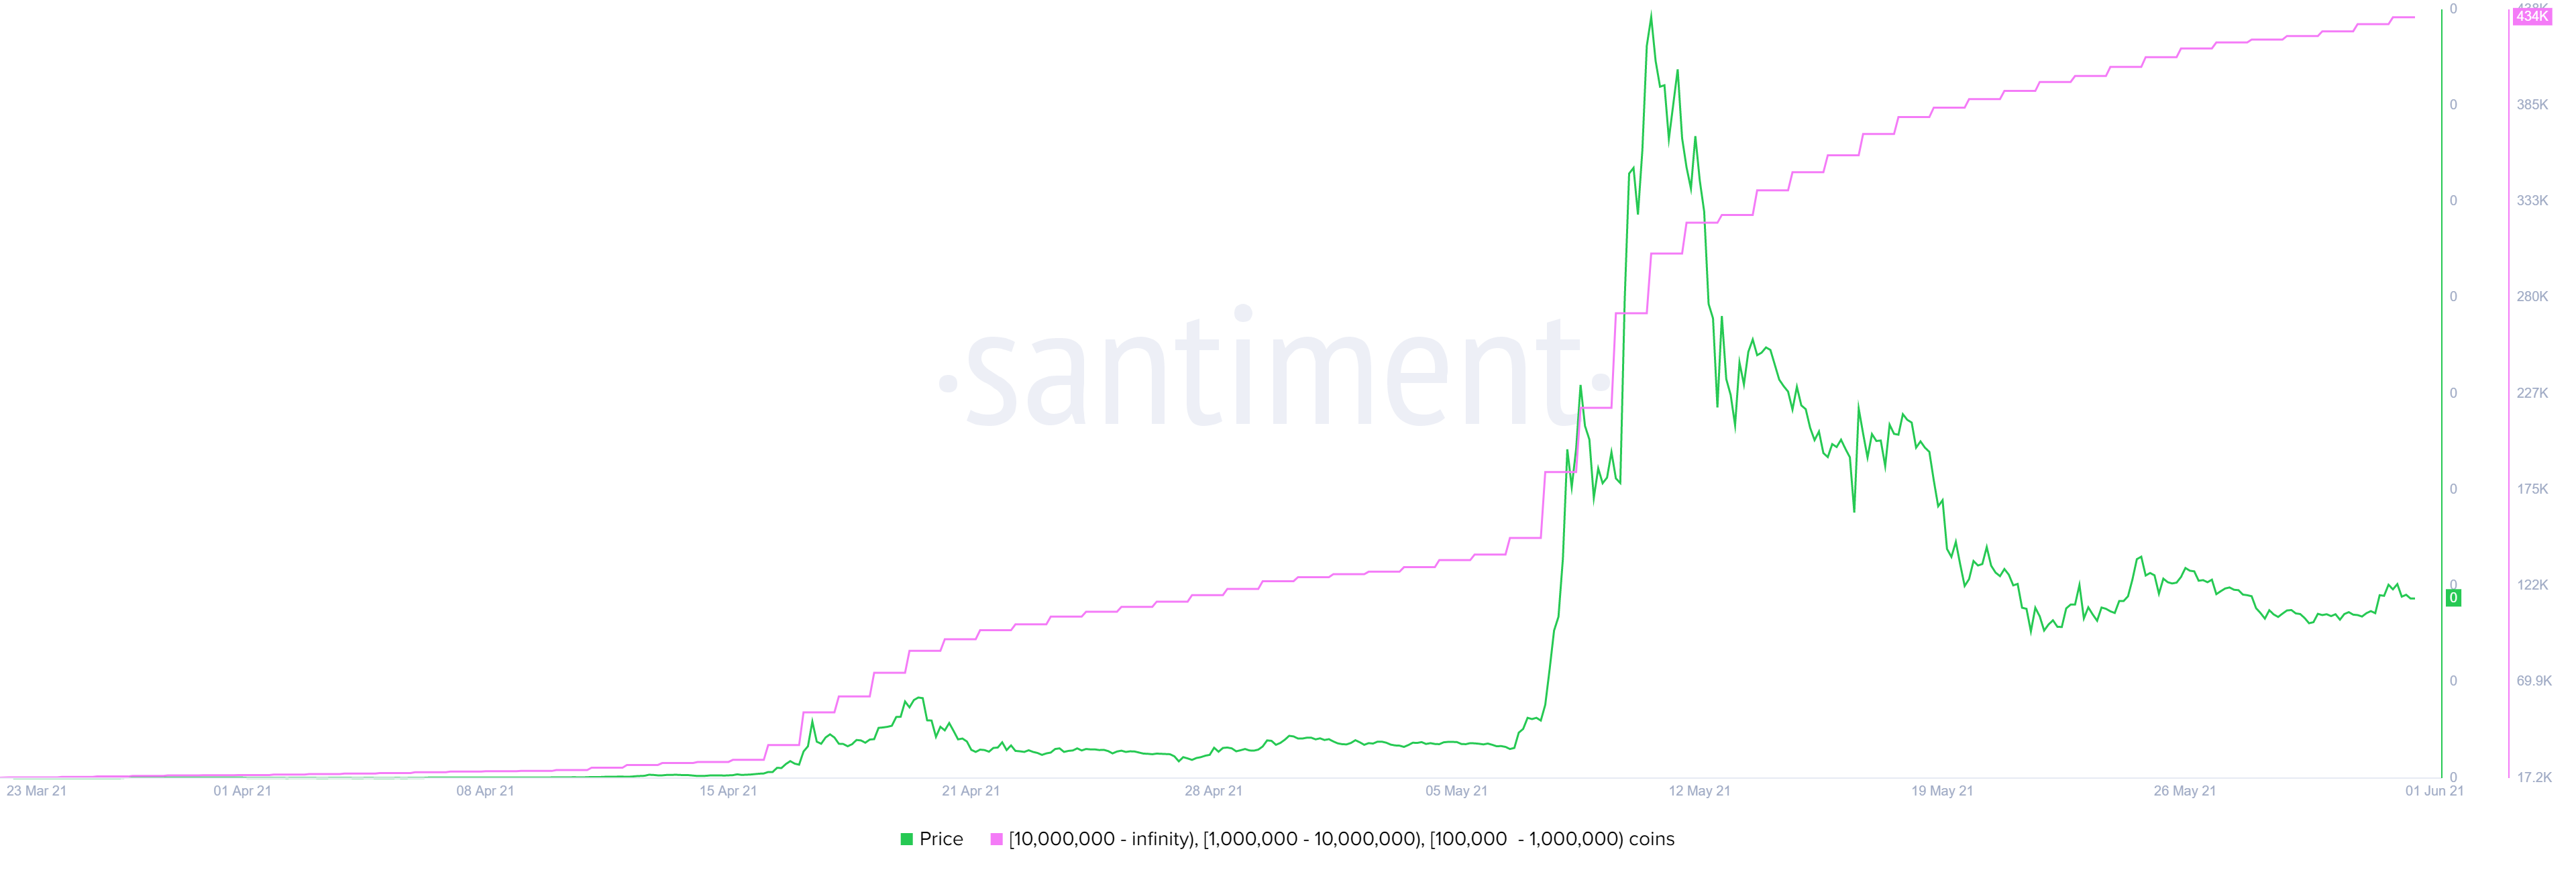
Shiba Inu supply distribution chart
Further explaining the accumulation is Santiment’s 30-day Market Value to Realized Value (MVRV) model. This fundamental index tracks the profit/loss of investors who purchased SHIB in the past month and shows that Shiba Inu price is in an “opportunity zone.”
At the time of writing, this metric is displaying -39%, indicating that the short-term sellers are panic-selling, providing the long-term holders to accumulate.
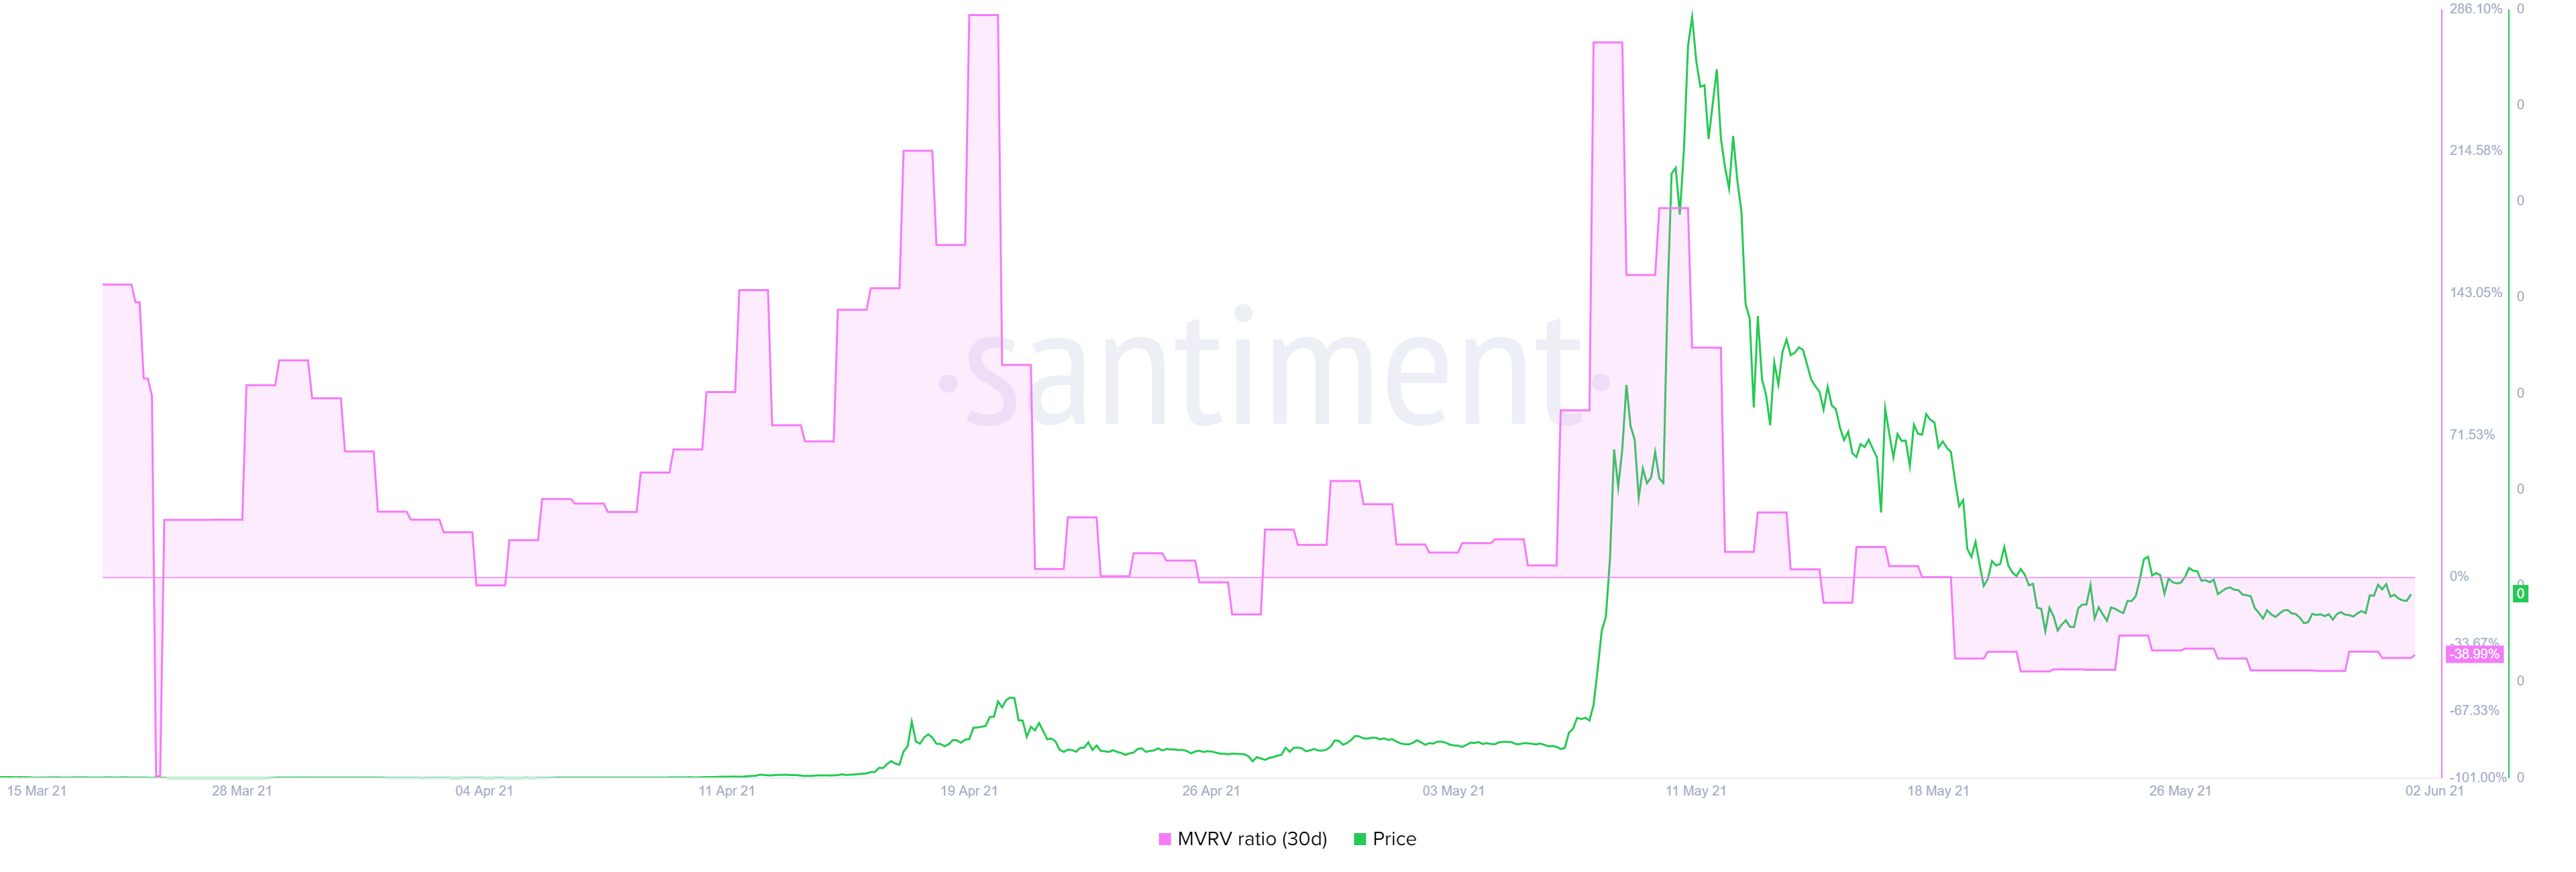
Shiba Inu 30-day MVRV chart
Fundamentals theorize a bright future
While the on-chain metrics are straightforward, fundamentals give an idea of the potential a project/company might have.
As for Shiba Inu, there are three main points of interest – ShibaSwap, Shiba Inu and NFTS, Shiba Inu Rescue.
ShibaSwap is a decentralized exchange (DEX) expected to house two other tokens – LEASH and BONE – that the project is creating. While both the tokens are ERC-20, they follow different token economics.
The DEX, according to the whitepaper (woofpaper), will have yield farming capabilities.
Another direction that Shiba Inu is focusing is the Non-Fungible Token (NFT) industry via its artist incubator, which will invite creators from various genres and platforms to create NFTs that are tradable on the ShibSwap DEX.
Lastly, the most impactful path that Shiba Inu is making is an effort to rescue Shibas around the world. In this direction, the Shiba Inu token utilizes Amazon’s built-in Smile feature to donate to this cause.
To conclude, Shiba Inu price range-bound for the momentum, but the launch of ShibaSwap or a significant development on the NFT hold the key to potentially triggering the 100% upswing detailed above.
Despite being tagged the “Dogecoin killer,” both the cryptocurrencies are primarily driven by retail hype and frenzy. Therefore, a potential spike in social mentions or celebrity endorsements could also add a tailwind to the bull rally that could double Shiba Inu price.
Author

Akash Girimath
FXStreet
Akash Girimath is a Mechanical Engineer interested in the chaos of the financial markets. Trying to make sense of this convoluted yet fascinating space, he switched his engineering job to become a crypto reporter and analyst.



