Shiba Inu Price Analysis: SHIB reversal complicates bullish narrative
- Shiba Inu price spikes 27% but fails to attract emotion and commitment from investors.
- SHIB price contraction leads to price expansion after the fifth inside day in nine trading days.
- Bias remains higher unless $0.00000727 folds.
Shiba Inu price stabilization at the apex level of a symmetrical triangle combined with an inside day lifted SHIB higher. Still, gains were short-lived as the meme token has fallen over 8% today. An inability to separate from the doldrums of the broader cryptocurrency markets leaves the Ethereum-based cryptocurrency searching for an organic catalyst to capitalize on the positive message being dictated by the charts.
Shiba Inu price generates new predictions and theories every day
From May 19 until May 24, Shiba Inu price formed a symmetrical triangle pattern with two reaction highs and three reaction lows with a measured move target of $0.00001450, representing a 50%. During the development of the triangle, SHIB close with consecutive inside days.
On May 24, Shiba Inu price executed an impulsive breakout from the symmetrical triangle pattern, generating a 30% gain. Still, SHIB failed to capitalize and quickly fell into a downward drift, highlighted by resistance at the 10-day simple moving average (SMA) and support at the triangle’s upper trend line.
During the May 28-30 period, Shiba Inu price balanced along the apex level of the symmetrical triangle, registering another inside day on May 30. The horizontal price action created a minor inverse head-and-shoulders pattern on the one-hour chart. Yesterday the pattern triggered, carrying SHIB to a gain of 27% at the intra-day high before closing up 18% and above the 10-day SMA, prompting DJ JY to ask, “You see them spikes?”
You see them spikes? #shibainu
— DJ JY (@DJJY) May 31, 2021
Shiba Inu price has reversed lower, taking SHIB below the 10-day SMA and near the triangle’s apex level.
In a fluid crypto market, Shiba Inu price could recapture buyers’ interest and drive SHIB up to the price range defined by the May 24 high at $0.00001204, the May 20 high at $0.00001214 and the May 16 low at $0.00001238, returning 45% to investors from the current price.
Additional resistance includes the 23.6% retracement of the May decline at $0.00001325. The 38.2% retracement at $0.00001793 will be complex as it aligns with a price cluster from 12 to May 18. Ambitious SHIB investors should be targeting the 50% retracement at $0.00002186.
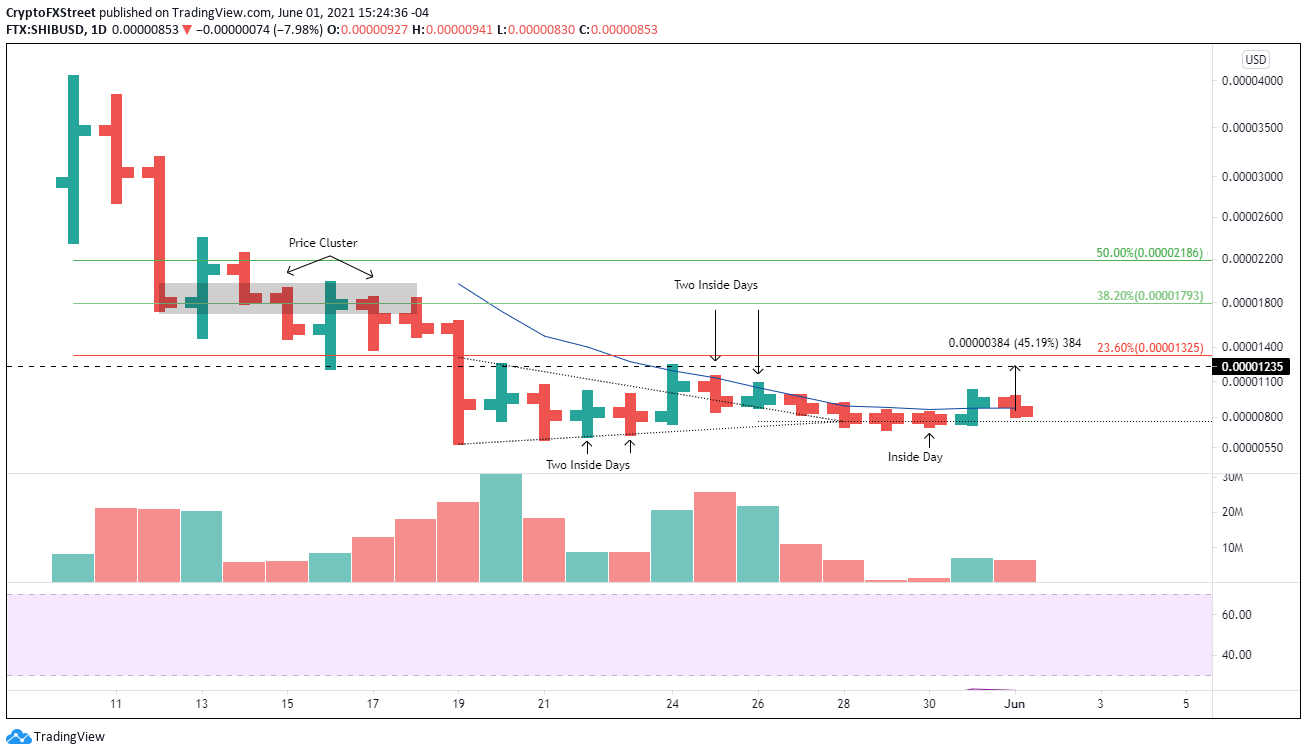
SHIB/USD daily chart
The Shiba Inu price action today does not defeat the bullish outlook unless the digital token closes below $0.00000727. A decline below $00000607 would confirm a negative view and put SHIB on course to print lows.
For now, the bias is tilted bullish, but the reversal of another spike following an inside day complicates the price structure and narrative that has been arranged on the charts.
Author

Sheldon McIntyre, CMT
Independent Analyst
Sheldon has 24 years of investment experience holding various positions in companies based in the United States and Chile. His core competencies include BRIC and G-10 equity markets, swing and position trading and technical analysis.


