Hedera Hashgraph Price Prediction: Trade what you see not what you feel
- Hedera Hashgraph price is currently down 10% on the day
- HBAR may be headed for a 14% decline targeting $0.066.
- Invalidation of the bearish thesis would arise from a break above $0.092

Hedera Hashgraph price shows short-term bearish technicals that may alter the bullish narrative in the coming days. Traders should remain unbiased during consolidation phases and continue to practice risk management while seeking profitable opportunities.
Hedera Hashgraph price setting up a pullback
Hedera Hashgraph price has taken a tumble near the upper bounds of the recently established uptrend. The downswing is a significant gesture that should be considered while trading the HBAR price, as the digital asset has been trading within a confining range for the last nine days.
Hedera Hashgraph price currently auctions at $0.083. The bears have forged an overthrow of the 8-day exponential moving average, which has provided support throughout the 1.5 x rally that began on January 1st. The breach could be viewed as a confirmation signal for the bears building their positions on smaller time frames.
Classical technical analysis would suggest multiplying the average trading range percentage by the total amount of candlesticks held within the range to extract a possible target. The 3-day chart shows two previous days of range-bound trading with a 10% spread between $0.082 and $0.091. Thus a 20% price decline targeting $0.066 could be the next market move for traders to participate in.
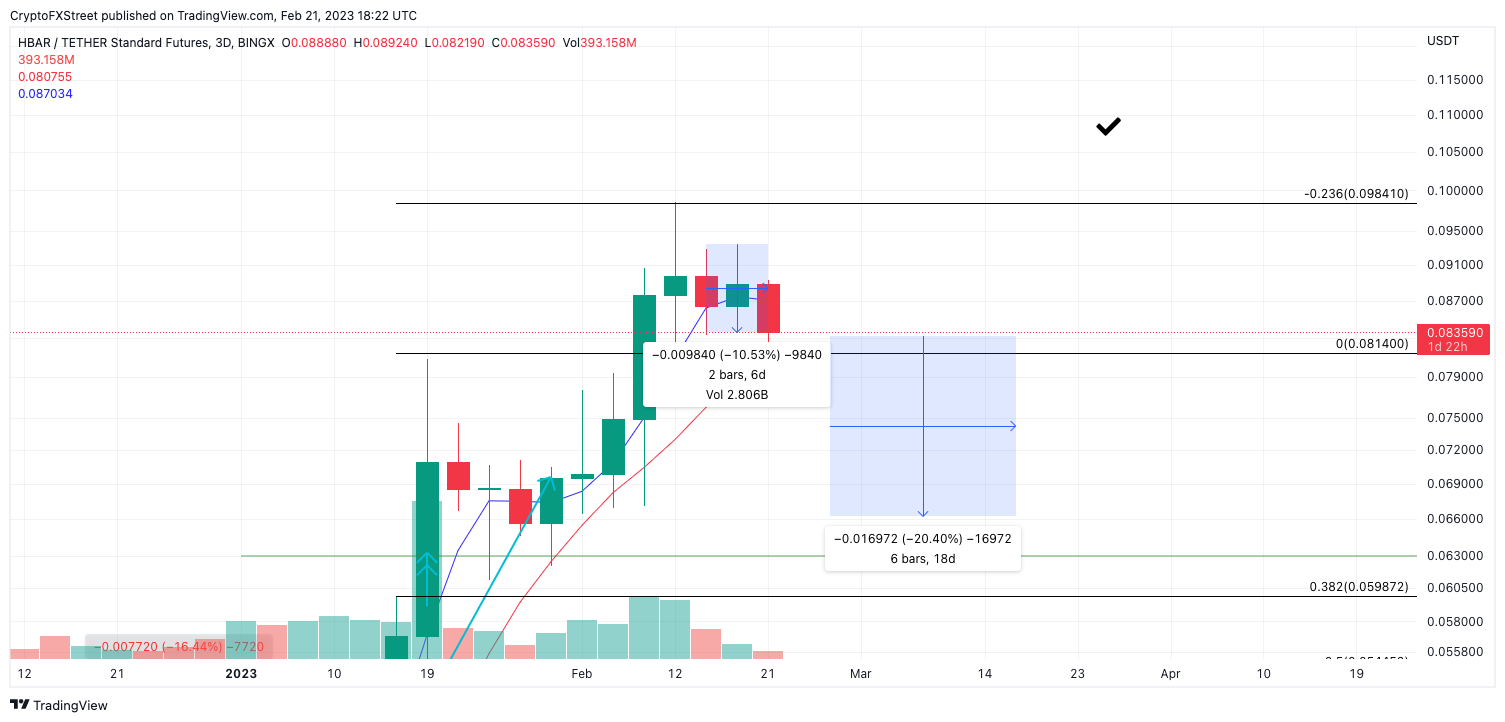
HBAR/USDT 1-Day Chart
Invalidation of the bearish thesis would arise from a breach above the recent 3-day range high at $0.092. A breach of the area could lead to a 20% move to the upside targeting the $0.105 liquidity zone. The bulls would rally by 21% from Hedera's current market value if the retaliation attempt is successful.
Author

Tony M.
FXStreet Contributor
Tony Montpeirous began investing in cryptocurrencies in 2017. His trading style incorporates Elliot Wave, Auction Market Theory, Fibonacci and price action as the cornerstone of his technical analysis.


