Hedera Hashgraph Price Prediction: Target hit or just about
- Hedera Hashgraph price soared by 28% last week
- HBAR could embark on a much steeper downtrend towards $0.05 if the $0.08 support zone fails to hold.
- Invalidation of the bear's thesis would occur with a breach above $0.09.

Hedera Hashgraph price could be on the brink of a strong downtrend. However, traders should look for confirmation signals before confidently joining the bears.
Hedera Hashgraph price headed south?
Hedera Hashgraph price soared by 28% last week, making it one of the best-performing digital assets in the cryptocurrency space. Despite several bullish outlooks outlining HBAR's potential to rally back into the $0.10-zone, on January 12, HBAR's rally felt just short of the target zone, marking a high of $0.098.
Hedera Hashgraph price currently auctions at $0.083 and has lost 16% of its value since missing the target of $0.10 by 2%. At the time of writing, the bears are testing the support zone near the recent barrier, which is also where the 8-day exponential moving average is floating.
Traders hoping to see the self-fulfilling $0.10 prophecy manifest should be cautious. The steep decline since falling short could be indicative of a sense of urgency from profit-taking investors.
Since January 1, the HBAR price rose by 176% into the year-to-date high at $0.098. A Fibonacci retracement tool surrounding the winter rally shows a strong confluence zone near the $0.049 barrier, with a 61.8% Fib level lying there.
If the 8-day EMA fails, a test of the 21-day simple moving average will occur at $0.072. If a candlestick closes beneath the aforementioned barrier, then a 30% decline towards the golden pocket Fibonacci zone at $0.049 would be a reasonable display of profit-taking, considering the impressive amount of gains for HBAR this year.
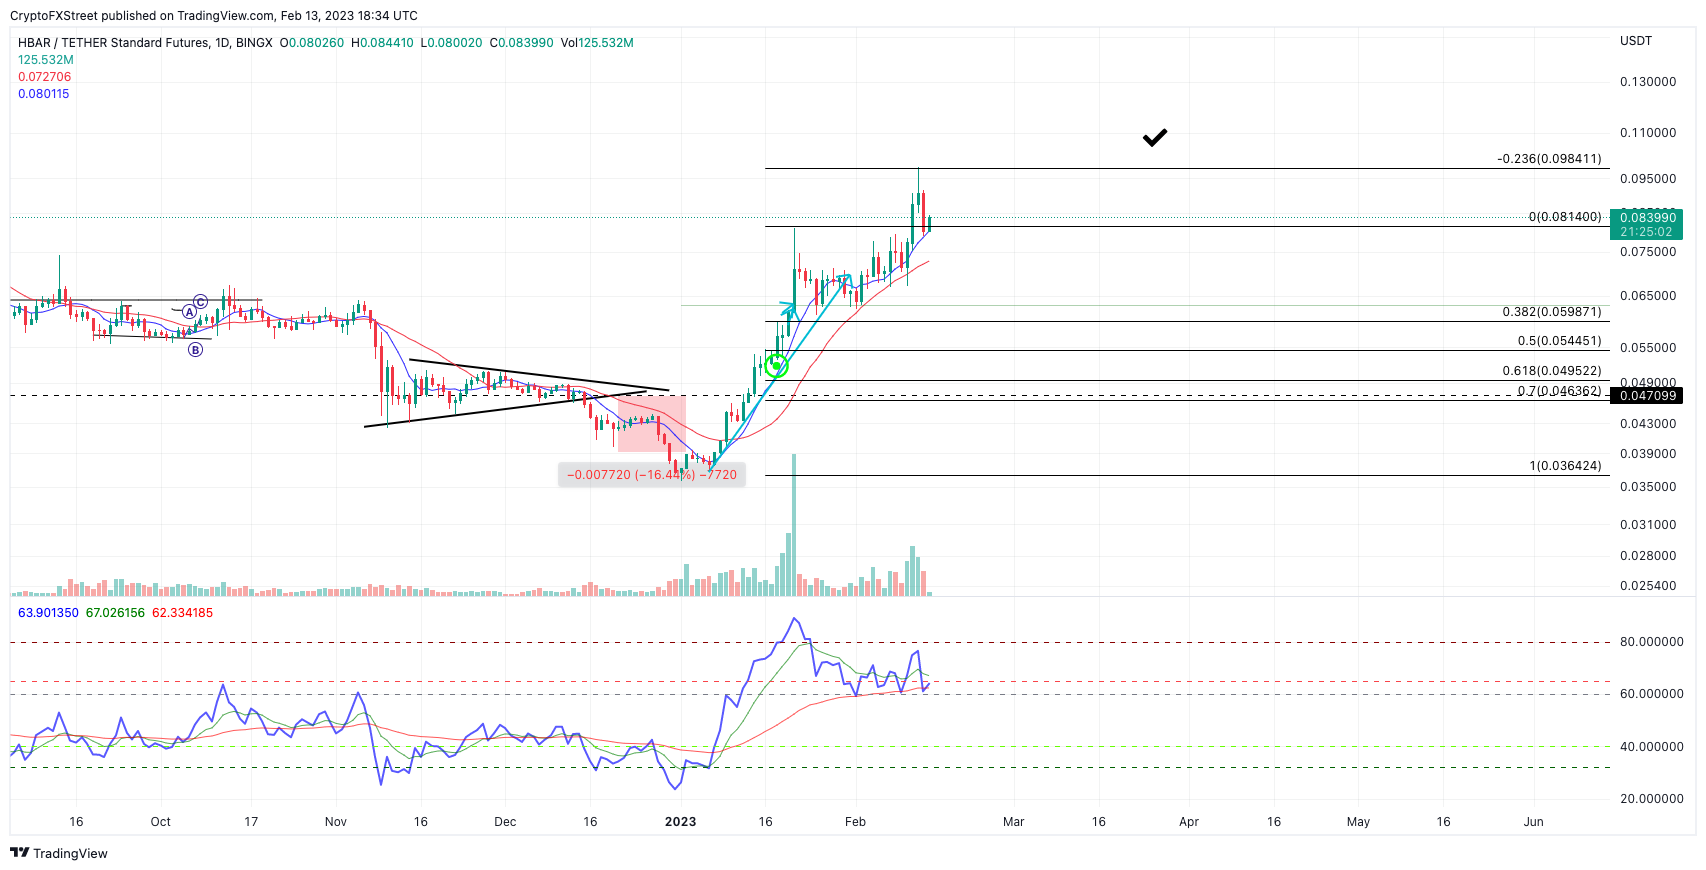
HBAR/USDT 1-Day Chart
Still, there is potential that the market will continue rallying higher as the 8-day EMA is still not given in. Invalidation of the bearish thesis could occur from the midway point of the current decline at $0.09. In doing so, the bulls would give way to another upswing targeting the $0.11 liquidity zone, resulting in a 33% increase from HBAR's current market value.
Author

Tony M.
FXStreet Contributor
Tony Montpeirous began investing in cryptocurrencies in 2017. His trading style incorporates Elliot Wave, Auction Market Theory, Fibonacci and price action as the cornerstone of his technical analysis.


