Hedera Hashgraph Price Prediction: HBAR continues to point north
- Hedera Hashgraph price continues to consolidate after a 1.4x rally.
- HBAR could be setting up for a rally toward $0.120.
- Invalidation of the bullish thesis would occur from a breach below $0.078.

Hedera hashgraph price shows optimistic signals that the winter rally will continue in the coming weeks. Traders should keep a close eye on HBAR as it seems poised to rally considerably.
Hedera Hashgraph price maintains strength
Hedera Hashgraph price has been consolidating in recent weeks after rallying 138% since January 1. Despite the consolidation, the bulls have maintained support above the 8-day exponential and 21-day simple moving averages, indicating that the overall trend remains bullish.
Hedera Hashgraph price is auctioning at $0.080. The Relative Strength Index (RSI) shows a healthy uptrend as it has breached overbought conditions and remains elevated above 70. Cryptocurrencies are known for continuously trending and overbought conditions, unlike other assets, such as commodities and stocks, which generally witness a pullback after entering the overbought zone. The elevated uptrend since its origin point could witness a steeper pullback for various reasons.
Considering the technicals, the $0.12 zone stands at a fair chance of being breached in the future, which would result in a 38% increase from the current HBAR price.
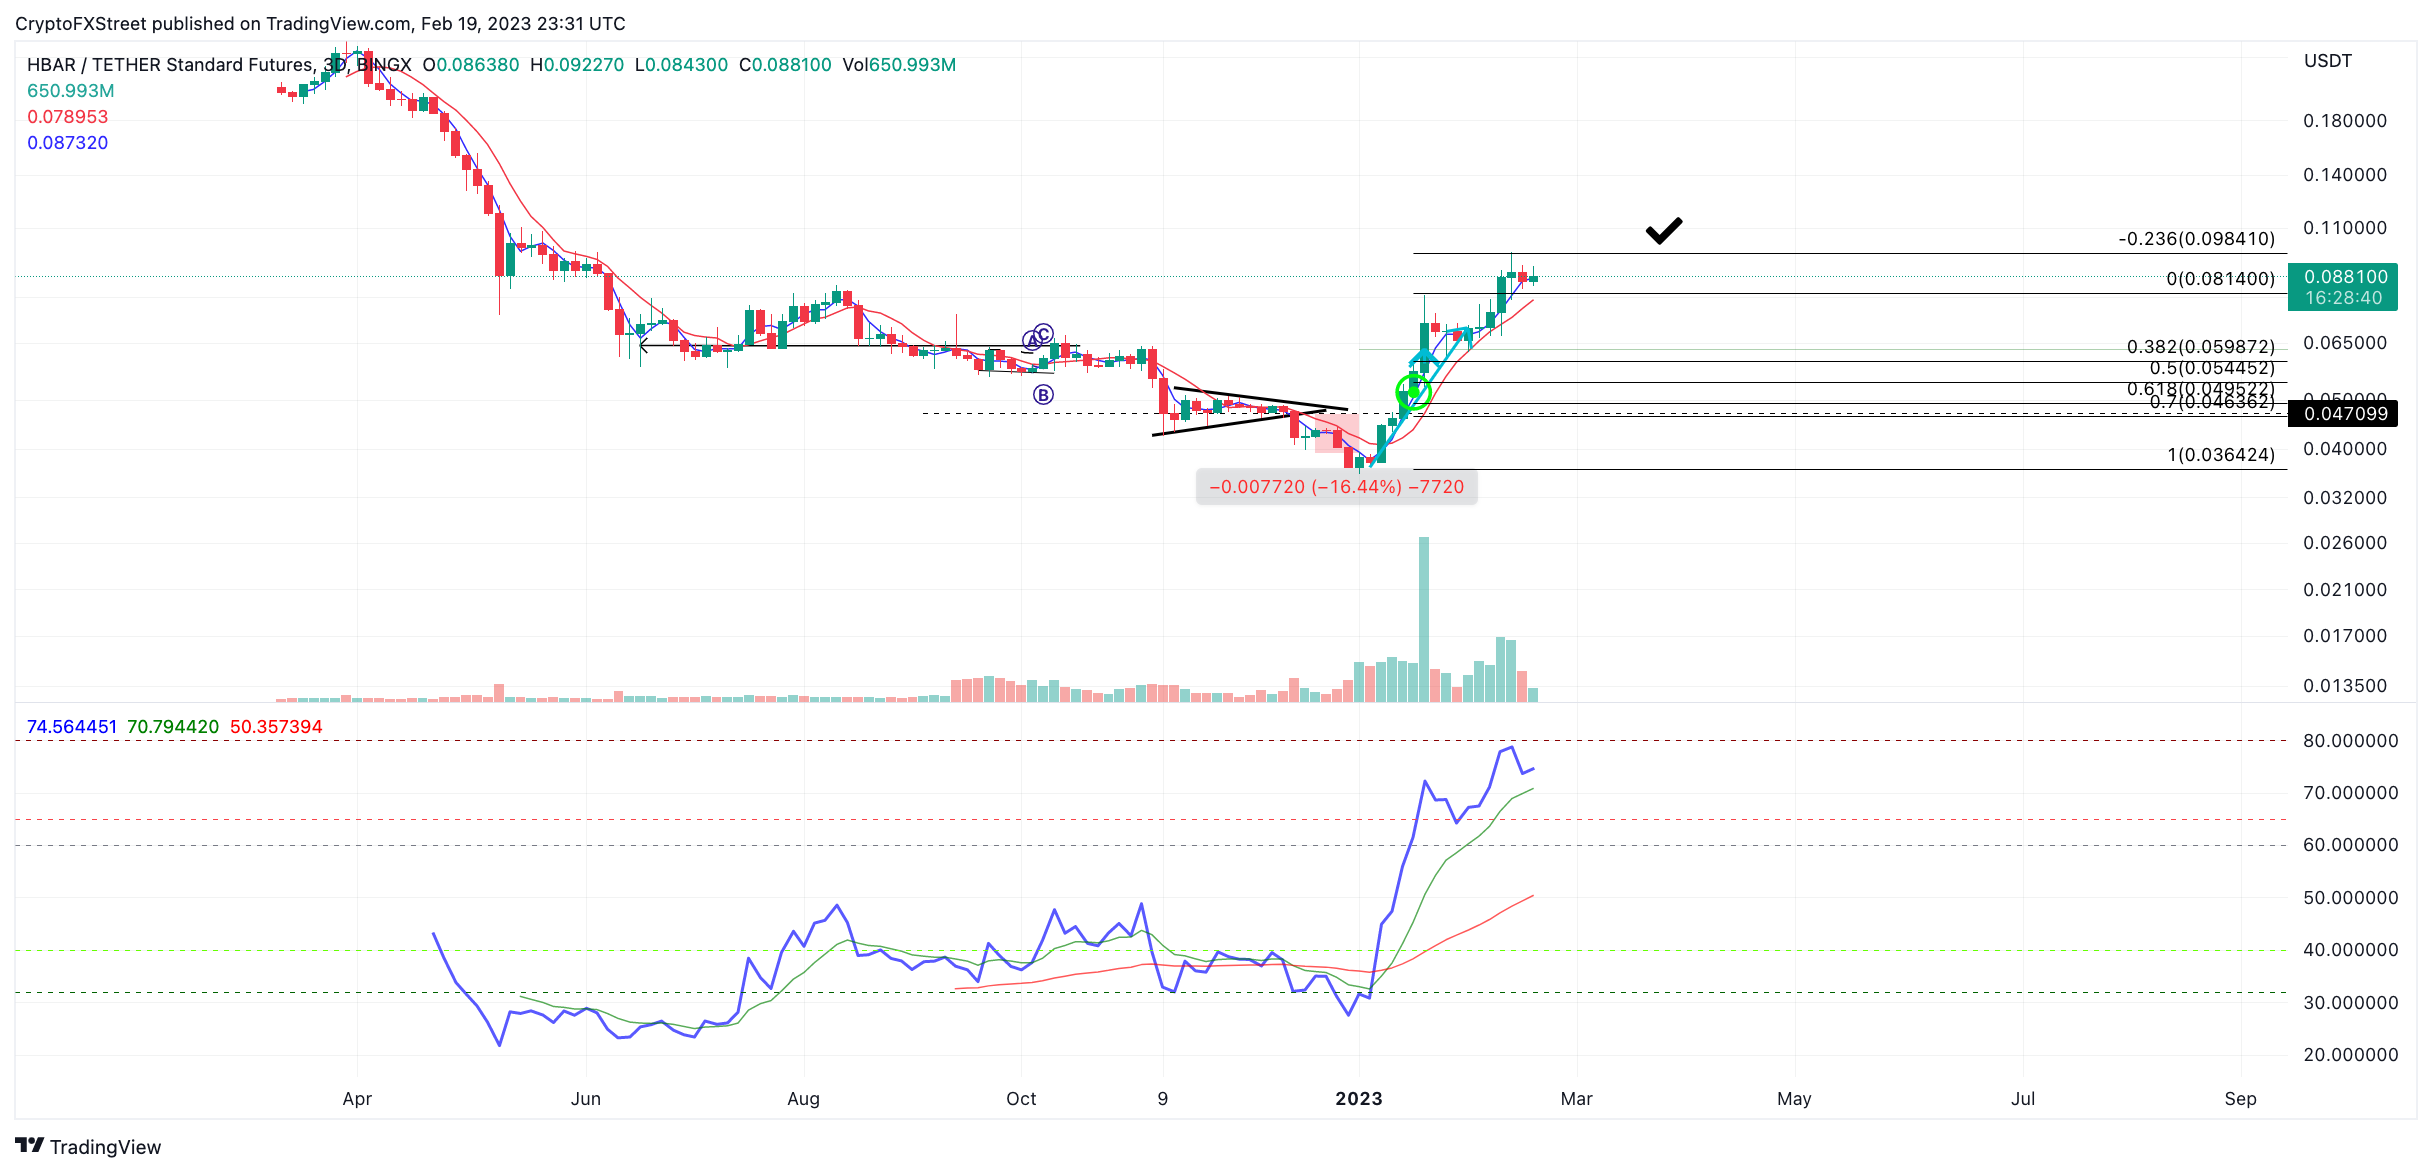
HBAR/USDT 1-Day Chart
The earliest signal to suggest the uptrend is subject to a steeper correction would come from a breach of the 21-day simple moving average at $0.078. If the breach occurs, the bulls would likely lose their footing, and a decline targeting the midway point of the winter rallied near the $0.040 zone would occur. Such a move could result in a 50% decline from HBAR's current market value.
Author

Tony M.
FXStreet Contributor
Tony Montpeirous began investing in cryptocurrencies in 2017. His trading style incorporates Elliot Wave, Auction Market Theory, Fibonacci and price action as the cornerstone of his technical analysis.


