Hedera Hashgraph Price Prediction: Uptrend shows reasonable doubt
- Hedera Hasgraph price is up 137% since January 1.
- HBAR could be setting up a decline toward the $0.05 region.
- Invalidation of the bearish thesis would come from a daily candlestick close above the $0.098 high.

Hedera Hashgraph price is up by 3% on the days but the uptrend shows reasons to be concerned. Technical analysis is being utilized to forecast HBAR's next potential move.
Hedera Hashgraph price is questionable
Hedera Hashgraph price is up 3 percent on the day support are being tested once again near the 8-day exponential moving average (EMA). The indicator has provided aid to HBAR's 137% rally since January 1 on several occasions. Hence, traders are skeptical, wondering how long the indicators' durability will last.
Hedera Hashgraph price currently auctions at 0.086. While the trend seems undoubtedly bullish, A conservative trade per-trade basis should be taken in the coming days as HBAR faces strong resistance in the $10 cents region.
The Relative Strength Index compounds the need for caution as several bearish divergences are showing During the winter rally. Additionally, the newly marked swing point at $0.091 Shows an M pattern on the rsi. According to classical technical analysis, the M pattern on the RSI is an immediate sell signal.
Considering these factors, pullback within the current uptrend stands a fair chance of occurring.
A Fibonacci retracement tool surrounding the winter rally shows a strong confluence zone between the $0.052 and $0.59 area. A decline toward these levels would result in a max reduction of 40% from HBAR's current market value.
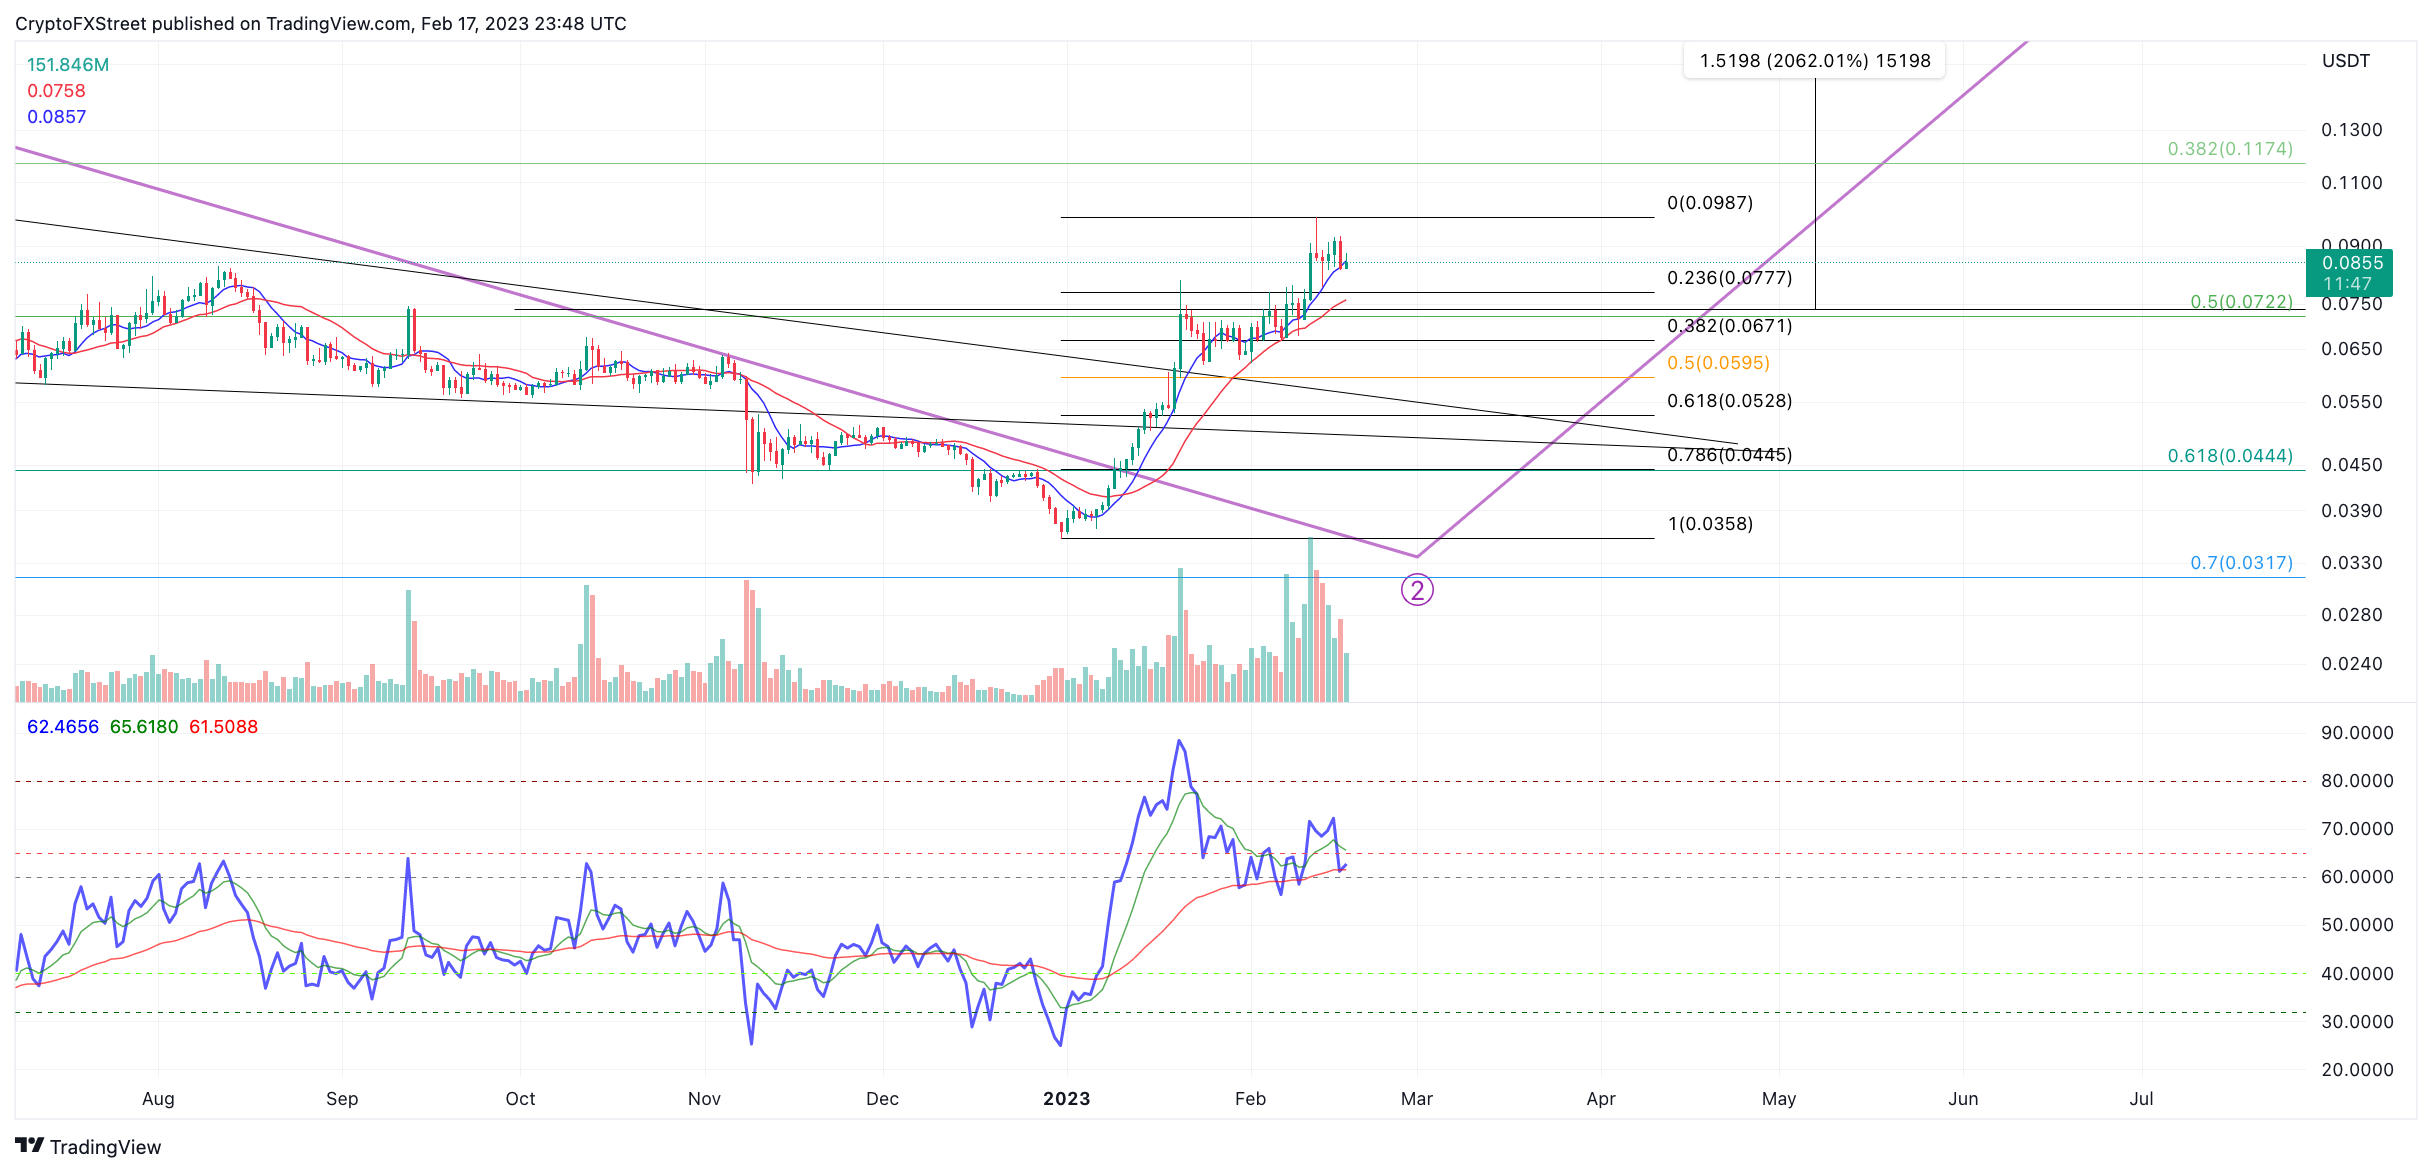
HBAR/USDT 1-Day Chart
If the RSI is correct, then the HBAR price should not be able to produce a candlestick close above the YTD swing high at $0.098. If the bulls produce a daily candlestick above the barrier, the uptrend will likely continue targeting liquidity levels as high as $0.12 cents in the short term. The Hedera Hashgraph price would rally 40% if the bulls were to succeed.
Author

Tony M.
FXStreet Contributor
Tony Montpeirous began investing in cryptocurrencies in 2017. His trading style incorporates Elliot Wave, Auction Market Theory, Fibonacci and price action as the cornerstone of his technical analysis.


