Hedera Hashgraph Prediction: Investors pleased with recent HBAR advancements
- Hedera Hashgraph price is up 30% since the start of 2023.
- HBAR could rally toward liquidity levels 10% above the current market value at $0.057.
- A breach of $0.042 could invalidate the bullish potential.

Hedera Hashgraph price has gone parabolic in recent days, hurdling previous resistance barriers between the $0.030-$0.040 zone. As of January 12, the scalable smart contract token stands 30% above January’s opening price of $0.036. When diving deeper into the technicals, it appears something profoundly different is taking place during the sudden spike in prices compared to previous rallies.
Hedera Hashgraph price surges
Hedera Hashgraph price currently auctions at $0.047 after postinga 3% return for bulls who entered the market 24 hours earlier and a 17% rise on the week. The volume indicator is used to gauge market behavior, and the momentum shows a significant uptick in transactions. Specifically, 1.1 billion dollars of transactions occurred on HBAR’s uptrend spike.
Since the initial influx, which doubled HBAR’s volume range throughout December according to BING exchange API), the volume indicator has remained elevated in the $700,000 zone throughout the week.
Based on the increased parameters, one could say that high-cap players are involved in HBAR”s current uptrend rally, a necessary factor for true market reversals.
The next bullish target zones lie 10% above the current HBAR price at $0.057. The liquidity levels were essential pivot points before HBAR”s 25% mudslide that occurred throughout the winter.
For traders to enter the market, the bullish invalidation would breach the 8-day exponential moving average at $0.042. A barrier breach could ultimately trigger a cascade of selling to target the 2022 low at $0.035. The HBAR price could decline 25% if the bears were to succeed.
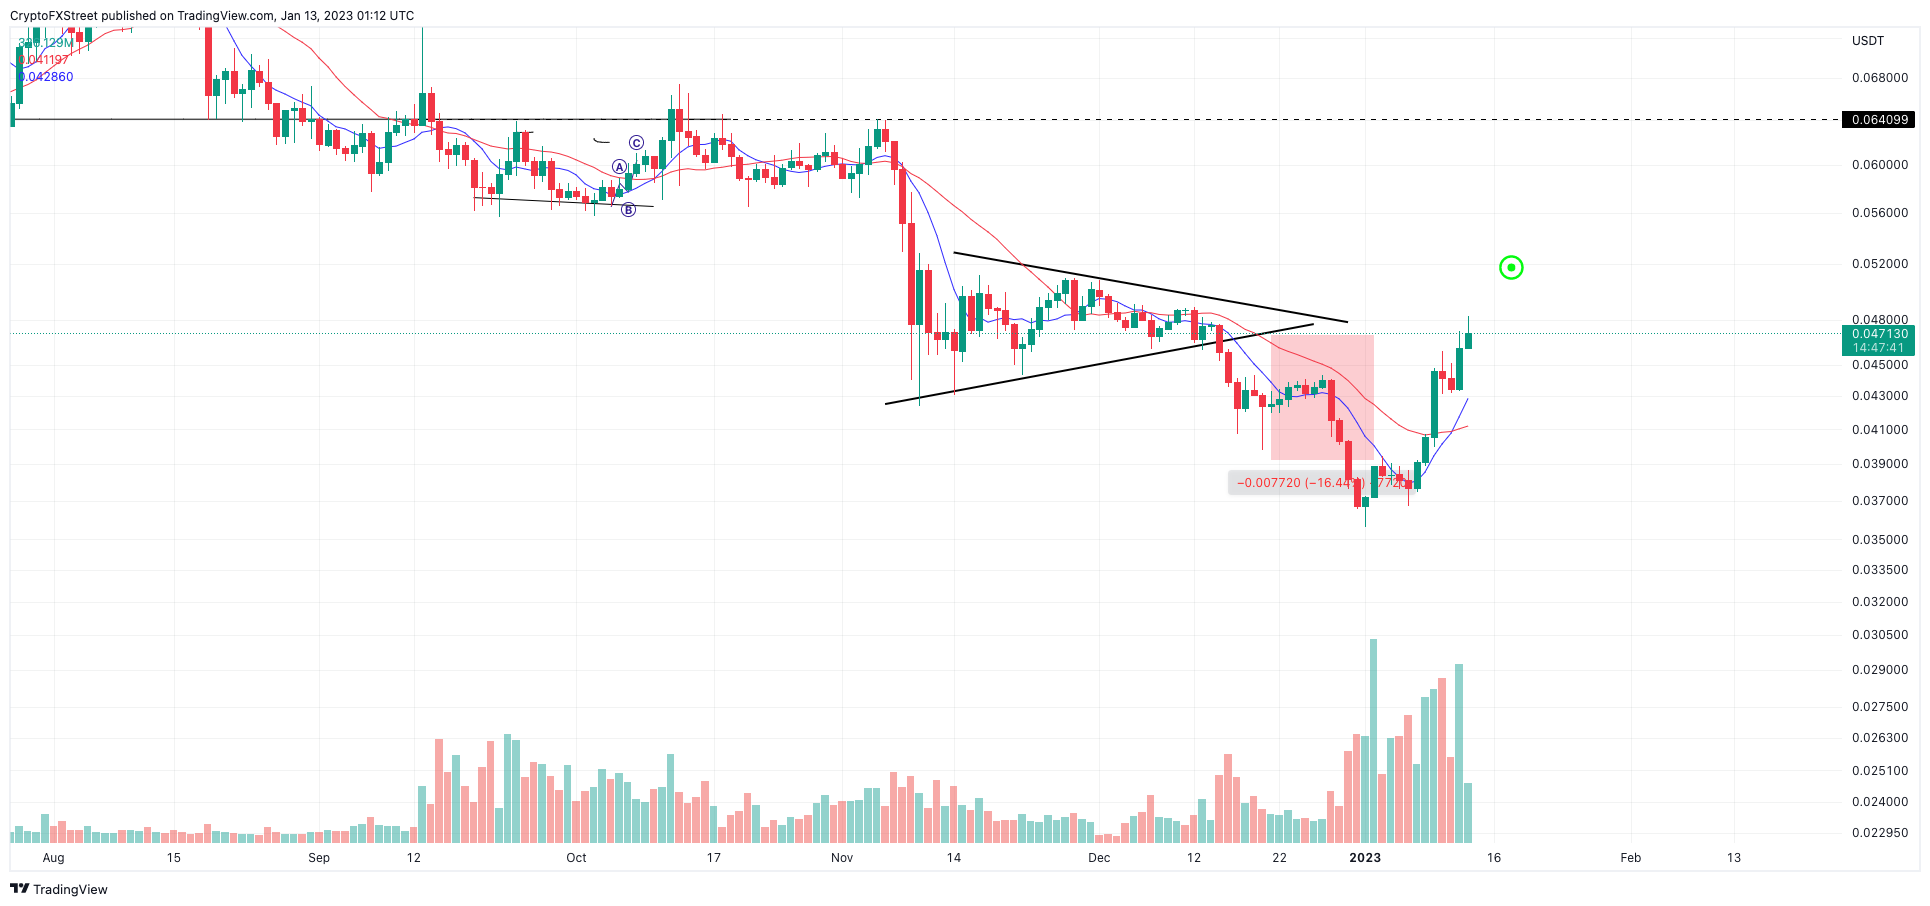
HBAR/USDT 1-Day Chart
Invalidation of the bearish thesis could occur, but the bulls will need to breach the 21-day simple moving average at $0.0410 to take the countertrend rally seriously. A breach above the barrier could induce a spike toward the mid $0.050 liquidity zone. HBAR would rise by 45% if the bulls were successful.
Author

Tony M.
FXStreet Contributor
Tony Montpeirous began investing in cryptocurrencies in 2017. His trading style incorporates Elliot Wave, Auction Market Theory, Fibonacci and price action as the cornerstone of his technical analysis.



