Hedera Hashgraph (HBAR) Price Prediction: Countertrend bulls seem poised for more gains


  • Hedera Hashgraph price rose by 18% after establishing new yearly lows earlier in the month. 
  • A bullish shooting star pattern occurred on the weekly time frame, which projects HBAR rising another 8% to 12%. 
  • A breach below $0.047 would invalidate the bulls’ potential to tackle the mid $0.05 zone. 

Hedera Hashgraph price shows potential to rally a bit higher before the bears flex their power again. Based on the confounding technicals, HBAR could rise by 12%. Still, this thesis will enable traders to take the smart-contract token's price action one step at a time.

Hedera Hashgraph price moves higher 

Hedera Hashgraph price has rallied by 18% on the month after falling into a new yearly low at $0.042 during the first week of November. On November 30, the smart contract token could hover above a recently breached 8-day exponential and 21-day simple moving averages. On the weekly time frame, the indicators produced the bullish cross signal as the 8-EMA flipped over the 21-SMA just below HBAR's trading range.

HBAR price currently auctions at $0.05. Investors should also make a note of the morning star pattern that was depicted on the November 21 settlement. Using the bullish engulfing candlestick within the pattern gives a projected target 10% above the current market value at $0.055. The aforementioned level has shown influence as it was a vital level of support throughout July and August. The barrier has yet to be retested since the bears pierced through it during the first week of November. 

tm/hbar/11/30/22

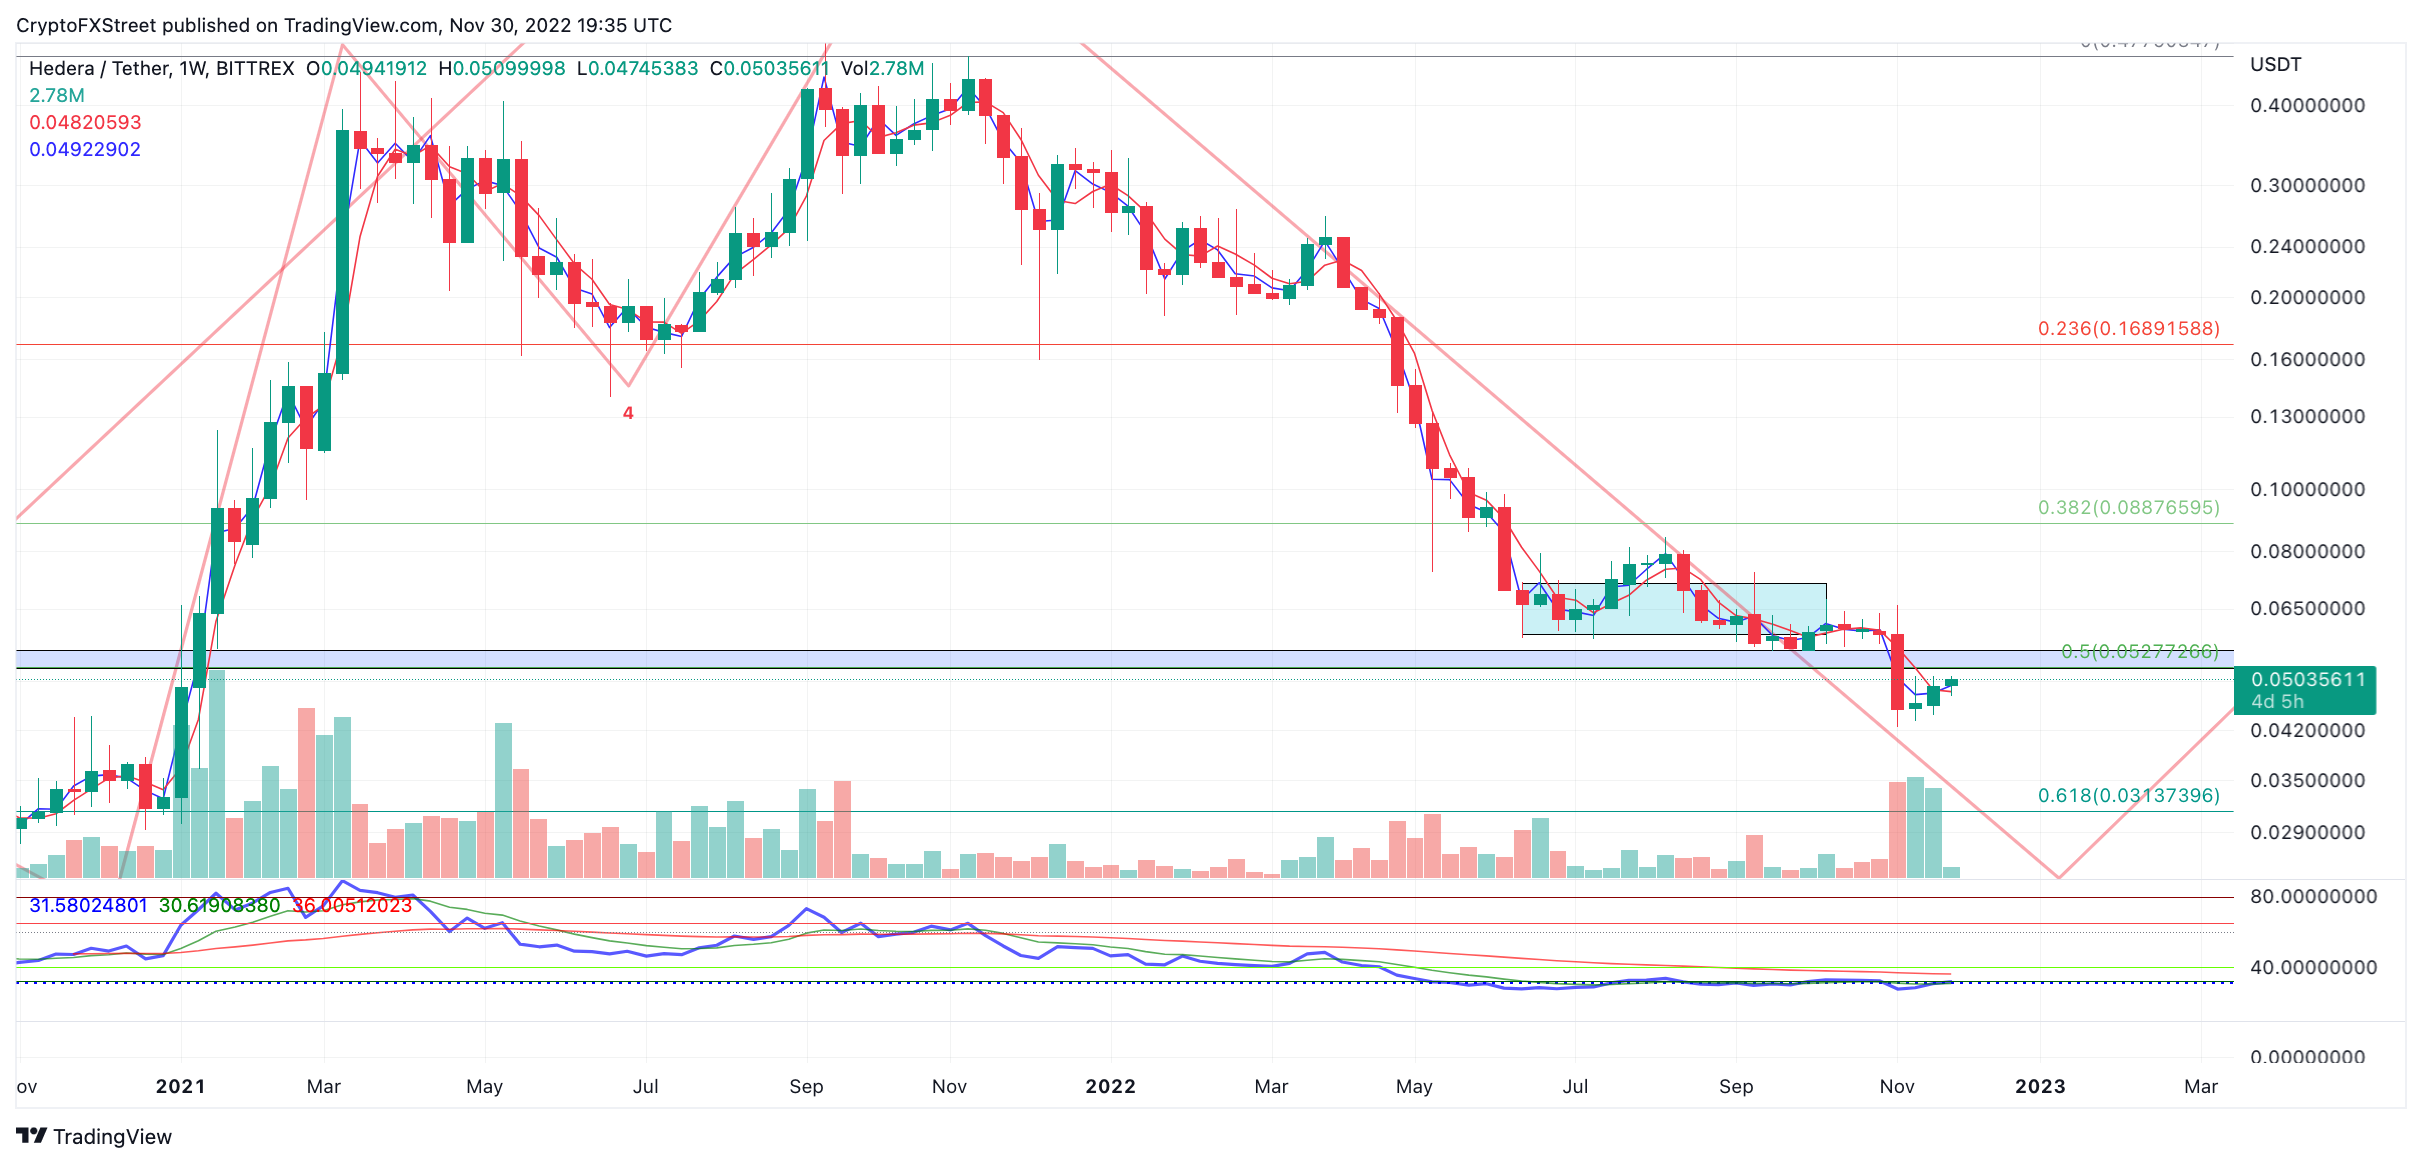
HBAR/USDT 1-week chart

If the market is genuinely bullish, the HBAR price should be on its way toward the mid $0.055 zone. A break below the recently interesting moving averages at $0.047 could invalidate the bulls’ potential to rally higher. If the Invalidation scenario occurs, the bears could re-route south, targeting new yearly lows. The 61.8% Fibonacci retracement level extracted from Hedera's 2020-2021 bull run at $0.031 would be a potential target. Hedera Hashgraph price would decline by 37% if said price action occurred.


Information on these pages contains forward-looking statements that involve risks and uncertainties. Markets and instruments profiled on this page are for informational purposes only and should not in any way come across as a recommendation to buy or sell in these assets. You should do your own thorough research before making any investment decisions. FXStreet does not in any way guarantee that this information is free from mistakes, errors, or material misstatements. It also does not guarantee that this information is of a timely nature. Investing in Open Markets involves a great deal of risk, including the loss of all or a portion of your investment, as well as emotional distress. All risks, losses and costs associated with investing, including total loss of principal, are your responsibility. The views and opinions expressed in this article are those of the authors and do not necessarily reflect the official policy or position of FXStreet nor its advertisers. The author will not be held responsible for information that is found at the end of links posted on this page.

If not otherwise explicitly mentioned in the body of the article, at the time of writing, the author has no position in any stock mentioned in this article and no business relationship with any company mentioned. The author has not received compensation for writing this article, other than from FXStreet.

FXStreet and the author do not provide personalized recommendations. The author makes no representations as to the accuracy, completeness, or suitability of this information. FXStreet and the author will not be liable for any errors, omissions or any losses, injuries or damages arising from this information and its display or use. Errors and omissions excepted.

The author and FXStreet are not registered investment advisors and nothing in this article is intended to be investment advice.

Recommended content


Recommended Content

Editors’ Picks

Bitcoin Weekly Forecast: Fed-led rally could have legs towards $65,000

Bitcoin Weekly Forecast: Fed-led rally could have legs towards $65,000

Bitcoin has risen 7% so far this week, supported by the US Fed interest-rate cut and more than $300 million in ETFs inflows. The recent surge led BTC price to shatter several key technical resistance levels, a sign that the current two-week rally has likely some more way to go towards $65,000.

More Bitcoin News
Ethereum, BNB and POL holders on the watch as BingX faces loss of $26 million in hack

Ethereum, BNB and POL holders on the watch as BingX faces loss of $26 million in hack

Crypto exchange BingX said on Friday that it suffered a hack, an attack that led to “minimal” losses that researchers at PeckShield estimate at $26.68 million.  The attacker swapped the stolen altcoins for Ethereum, Binance Coin and Polygon tokens, according to on-chain data. 

More Cryptocurrencies News
Pepe price forecast: Eyes for 30% rally

Pepe price forecast: Eyes for 30% rally

Pepe extends the upward movement on Friday after breaking above the descending trendline and resistance barrier on Thursday. PEPE’s dormant wallets are in motion, and the long-to-short ratio is above one, further supporting this bullish move and hinting at a rally on the horizon.

More PEPE News
Shiba Inu is poised for a rally as price action and on-chain metrics signal bullish momentum

Shiba Inu is poised for a rally as price action and on-chain metrics signal bullish momentum

Shiba Inu remains strong on Friday after breaking above a symmetrical triangle pattern on Thursday. This breakout signals bullish momentum, further bolstered by a rise in daily new transactions that suggests a potential rally in the coming days.

More Shiba Inu News
Bitcoin: Fed-led rally could have legs towards $65,000

Bitcoin: Fed-led rally could have legs towards $65,000

Bitcoin (BTC) has risen 7% so far this week, supported by the US Federal Reserve (Fed) interest-rate cut and more than $300 million in ETFs inflows. The recent surge led BTC price to shatter several key technical resistance levels, a sign that the current two-week rally has likely some more way to go towards $65,000.

Read full analysis
Moneta Markets review 2024: All you need to know

Moneta Markets review 2024: All you need to know

VERIFIED In this review, the FXStreet team provides an independent and thorough analysis based on direct testing and real experiences with Moneta Markets – an excellent broker for novice to intermediate forex traders who want to broaden their knowledge base.

Read More

BTC

ETH

XRP