Hedera Hashgraph (HBAR) Price Prediction: Bears are still in control until these factors change
- Hedera Hashgraph price declined by 27% in December.
- HBAR remains suppressed beneath two significant short-term barriers.
- The bulls need to hurdle above the $0.042 liquidity level to create more upside potential.

Hedera Hashgraph price witnessed a severe decline during December, battered more than most cryptocurrencies in the market. The bears could breach 2020 liquidity levels if market conditions persist.
Hedera Hashgraph price points south
Hedera Hashgraph price broke a 30-day consolidation to the downside during the final days of December. By the end of the month, the bears successfully withdrew 27% of market value from the highly scalable smart contract token.
HBAR price currently auctions at $0.0380. A 6% countertrend bounce has occurred since the bearish downswing. However, the uptrend momentum is already failing as the hike has halted since engaging with the 8-day exponential moving average (EMA).
HBAR’s failure to cross through the barrier tells of the bearish power, as several cryptocurrencies in the space have been able to cross the same resistance level this week. If the market is genuinely bearish, the bears will likely be unable to produce a candlestick close above the 8-day EMA, and a liquidation event could occur, targeting the 2022 lows at $0.0365.
A breach of the low could induce a bearish rally targeting the 2020 liquidity levels established near $0.0300 and potentially $0.0270. The downswing potential creates the possibility for a 30% decline in the weeks to come,
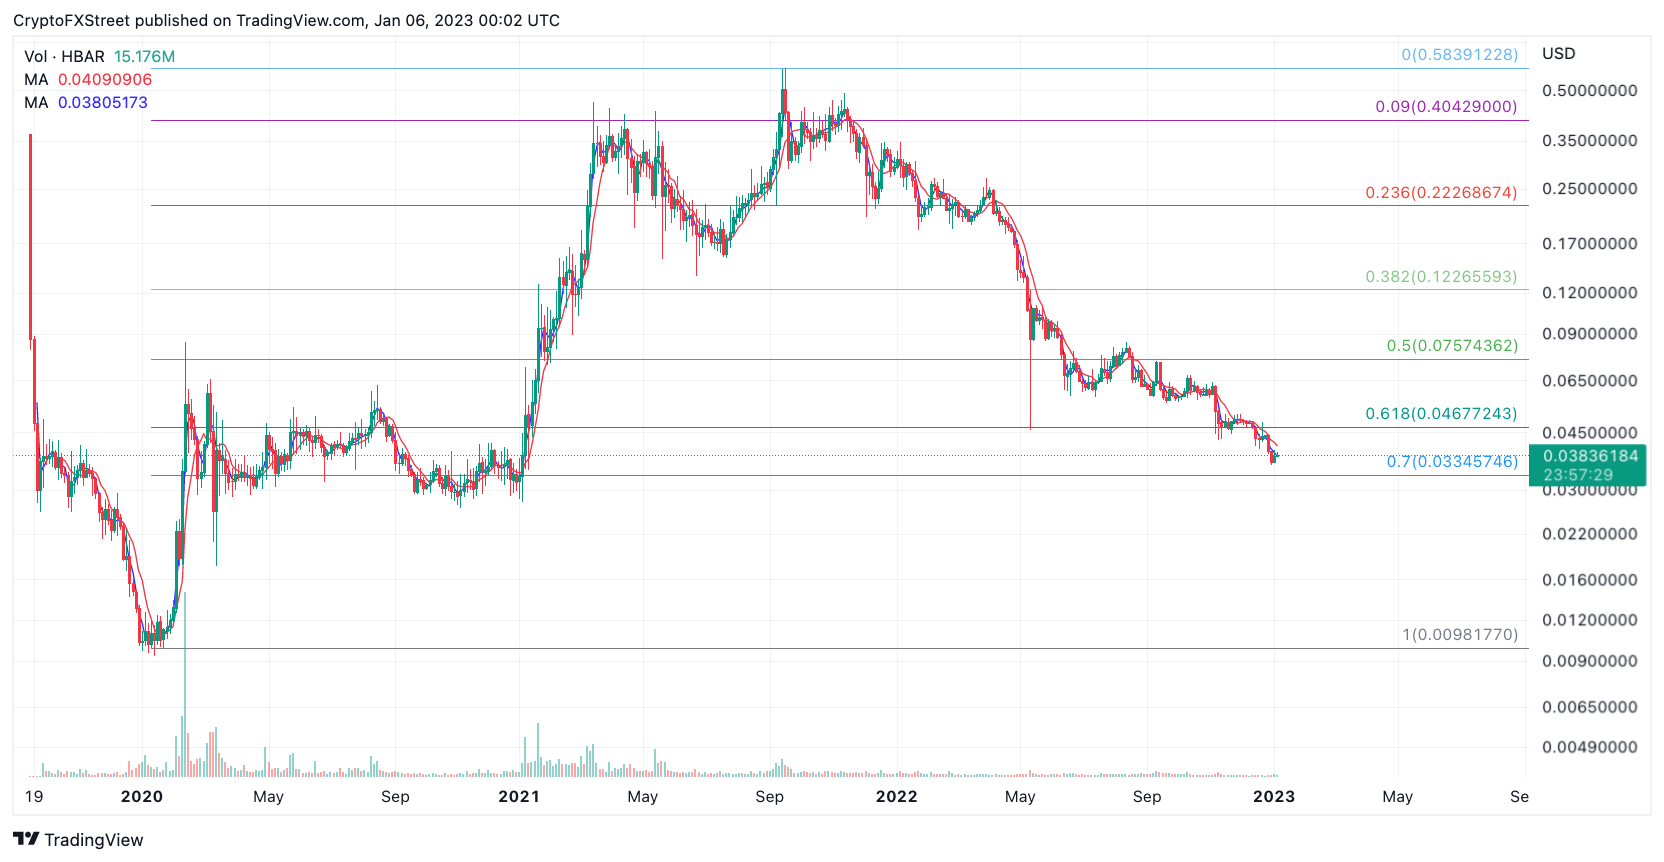
HBAR/USDT 3-Day Chart
Invalidation of the bearish thesis could occur, but the bulls will need to breach the 21-day simple moving average at $0.0410 to take the countertrend rally seriously. A breach above the barrier could induce a spike toward the mid $0.050 liquidity zone. HBAR will rise by 45% if the bulls are successful.
Author

Tony M.
FXStreet Contributor
Tony Montpeirous began investing in cryptocurrencies in 2017. His trading style incorporates Elliot Wave, Auction Market Theory, Fibonacci and price action as the cornerstone of his technical analysis.



