Hedera Hashgraph (HBAR) Price Prediction: The next move defines the trend
- HBAR price has rallied impulsively, recovering 15% of market losses.
- An influx of volume accompanies the impulsive rally with larger transactions than the previous 33% decline.
- Invalidation of the bullish thesis is a breach of $0.043.

Hedera Hashgraph price may be preparing to challenge recently established bears in the market. If the market is genuinely bullish, an additional 15% rally could occur in the coming days. Key levels have been identified for day traders to approach the self-proclaimed Ethereum killer token dynamically.
HBAR price shows bullish interest
Hedera Hashgraph price should be on every crypto trader's watch list, as the smart contract token could produce a profitable opportunity in the coming days. HBAR price has lost 33% of its market value since the start of November. The steep bearish decline wiped out liquidity levels as far back as 2020. Near the newfound lows at $0.042, the Volume Profile Index began showing an increase in transactions. On November 14, after producing a higher low, the bulls produced a strong impulsive rally with a larger uptick in volume than the previous decline.
HBAR price currently auctions at $0.048. The bulls are attempting to utilize the recently breached 8-day exponential moving average as support before rallying higher. If the bulls are successful, the next target to aim for would be the 21-day simple moving average at $0.056 for an additional 15% gain.
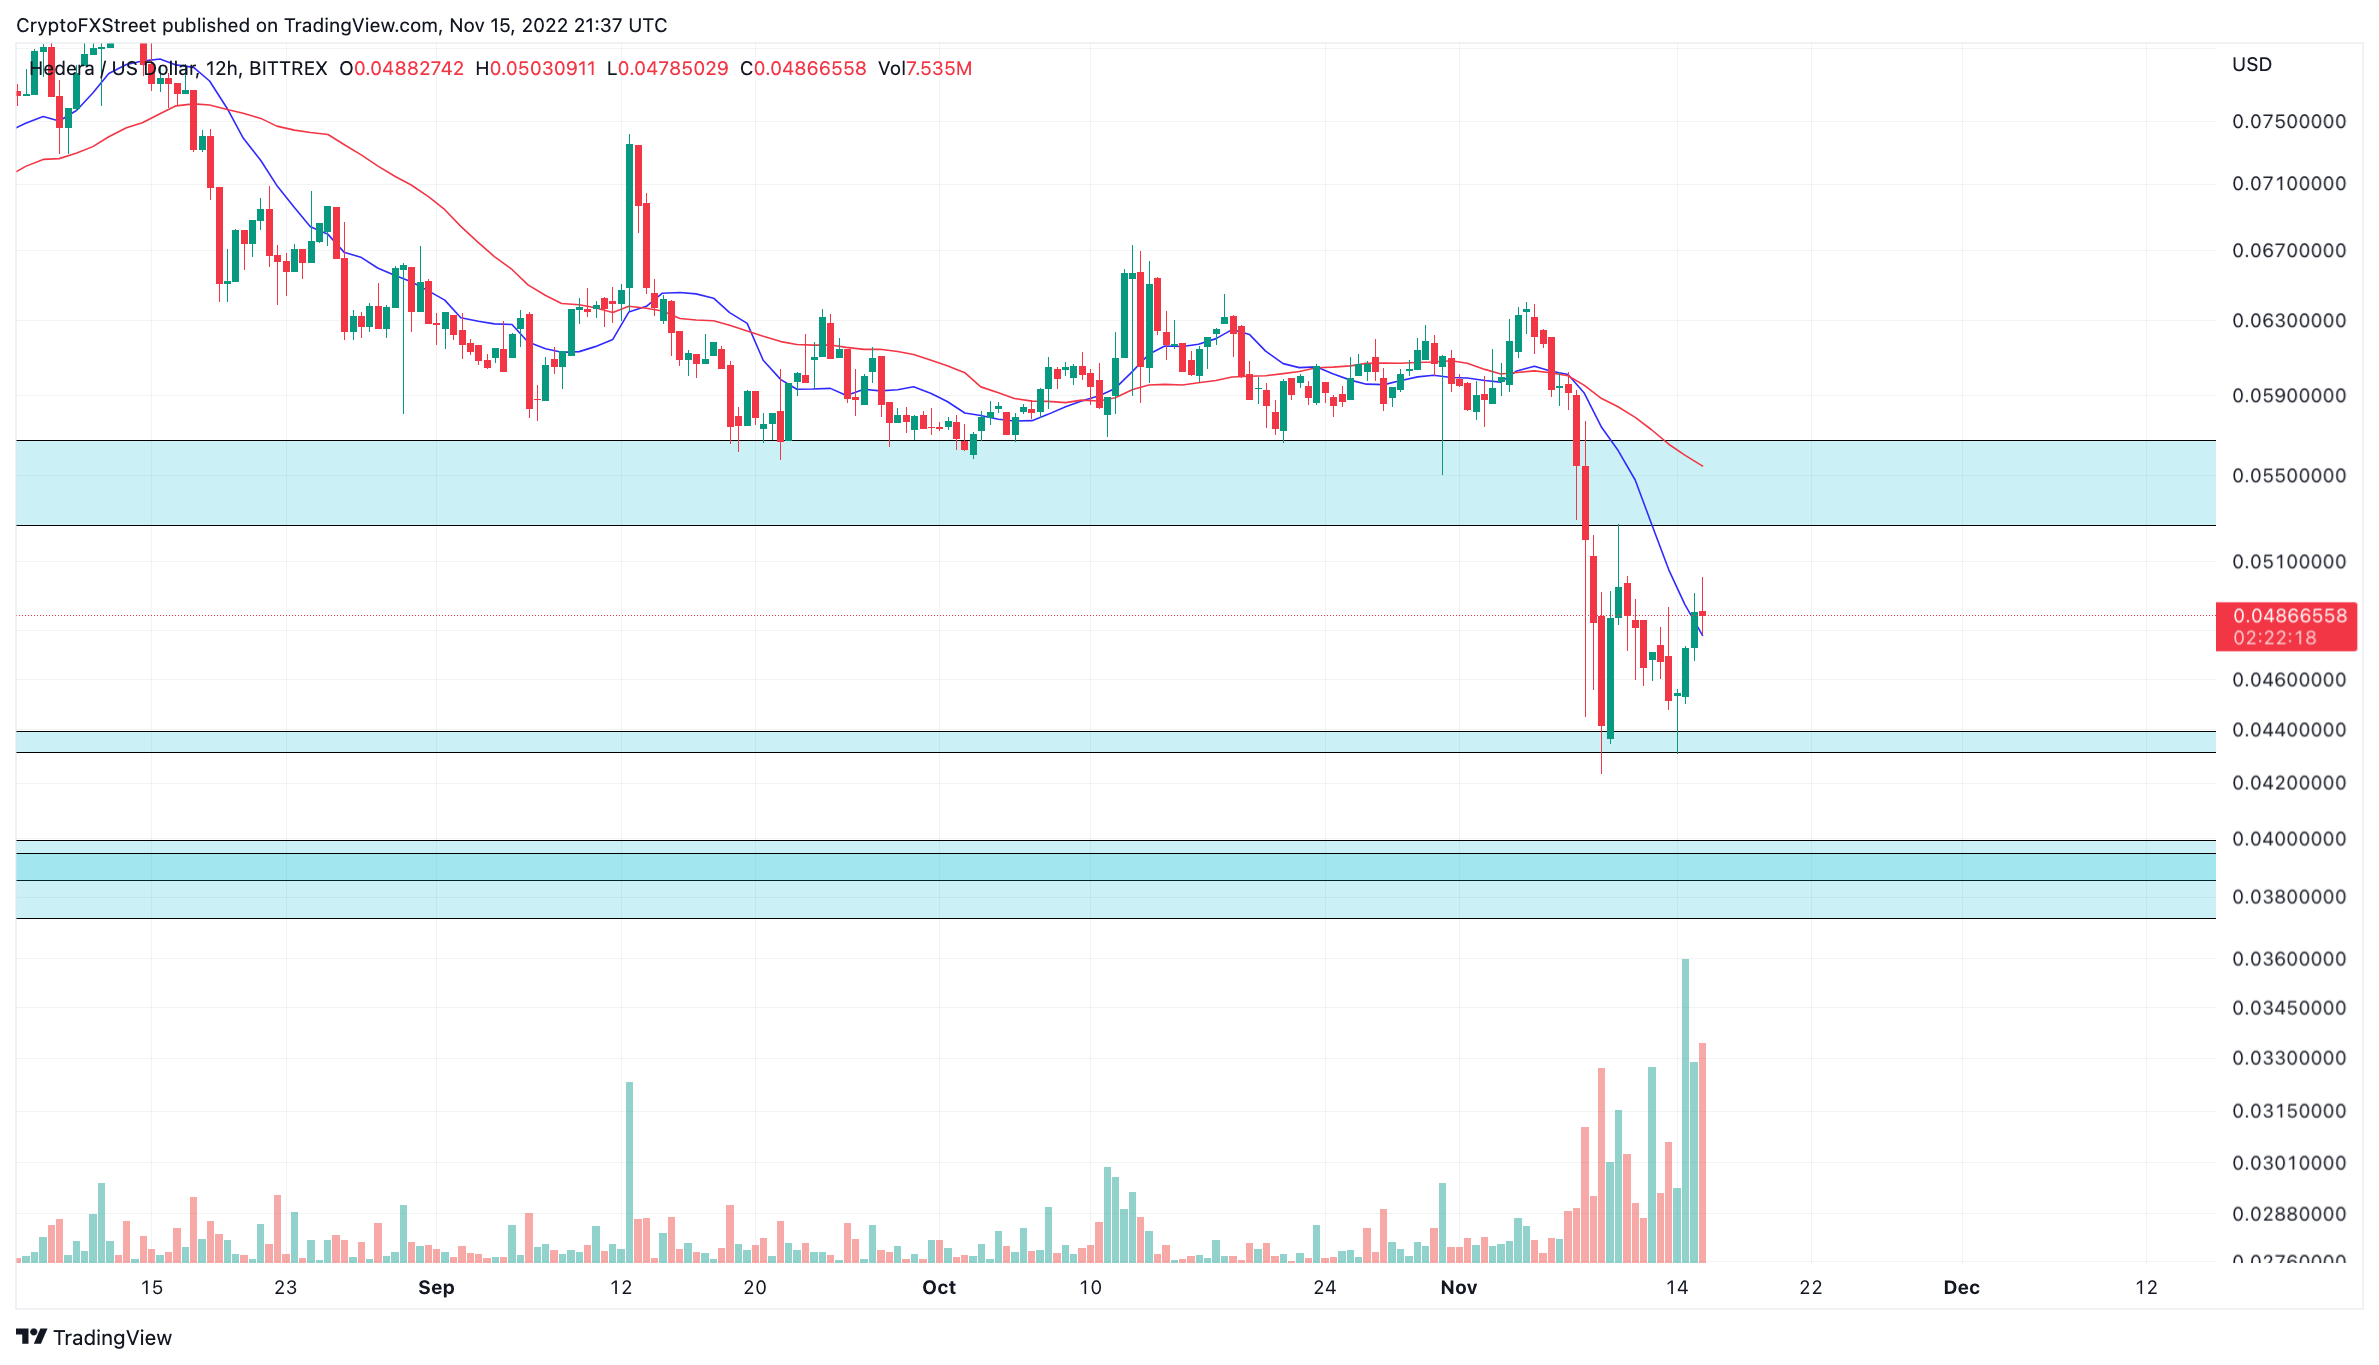
HBARUSD 12-Hour Chart
Invalidation of the bearish thesis could occur if the higher low at $0.043 were to get breached. If the invalidation point is breached, a downtrend move targeting the 2020 liquidity levels in the mid $0.038 zone one could occur. Such a move would result in a 24% decrease from the current HBAR price.
In the following video, our analysts deep dive into the price action of HBAR, analyzing key levels of interest in the market. -FXStreet Team
Author

Tony M.
FXStreet Contributor
Tony Montpeirous began investing in cryptocurrencies in 2017. His trading style incorporates Elliot Wave, Auction Market Theory, Fibonacci and price action as the cornerstone of his technical analysis.


