Four reasons why XRP price will crash to $0.65
- XRP price has been on a steady downswing since September 7 and shows no signs of recovery.
- The massive RSI divergence and 365-day MVRV seems to have played a pivotal role in this crash.
- A retest of the parallel channel’s lower trend line at $0.84 or $0.77 seems plausible if the downswing continues.

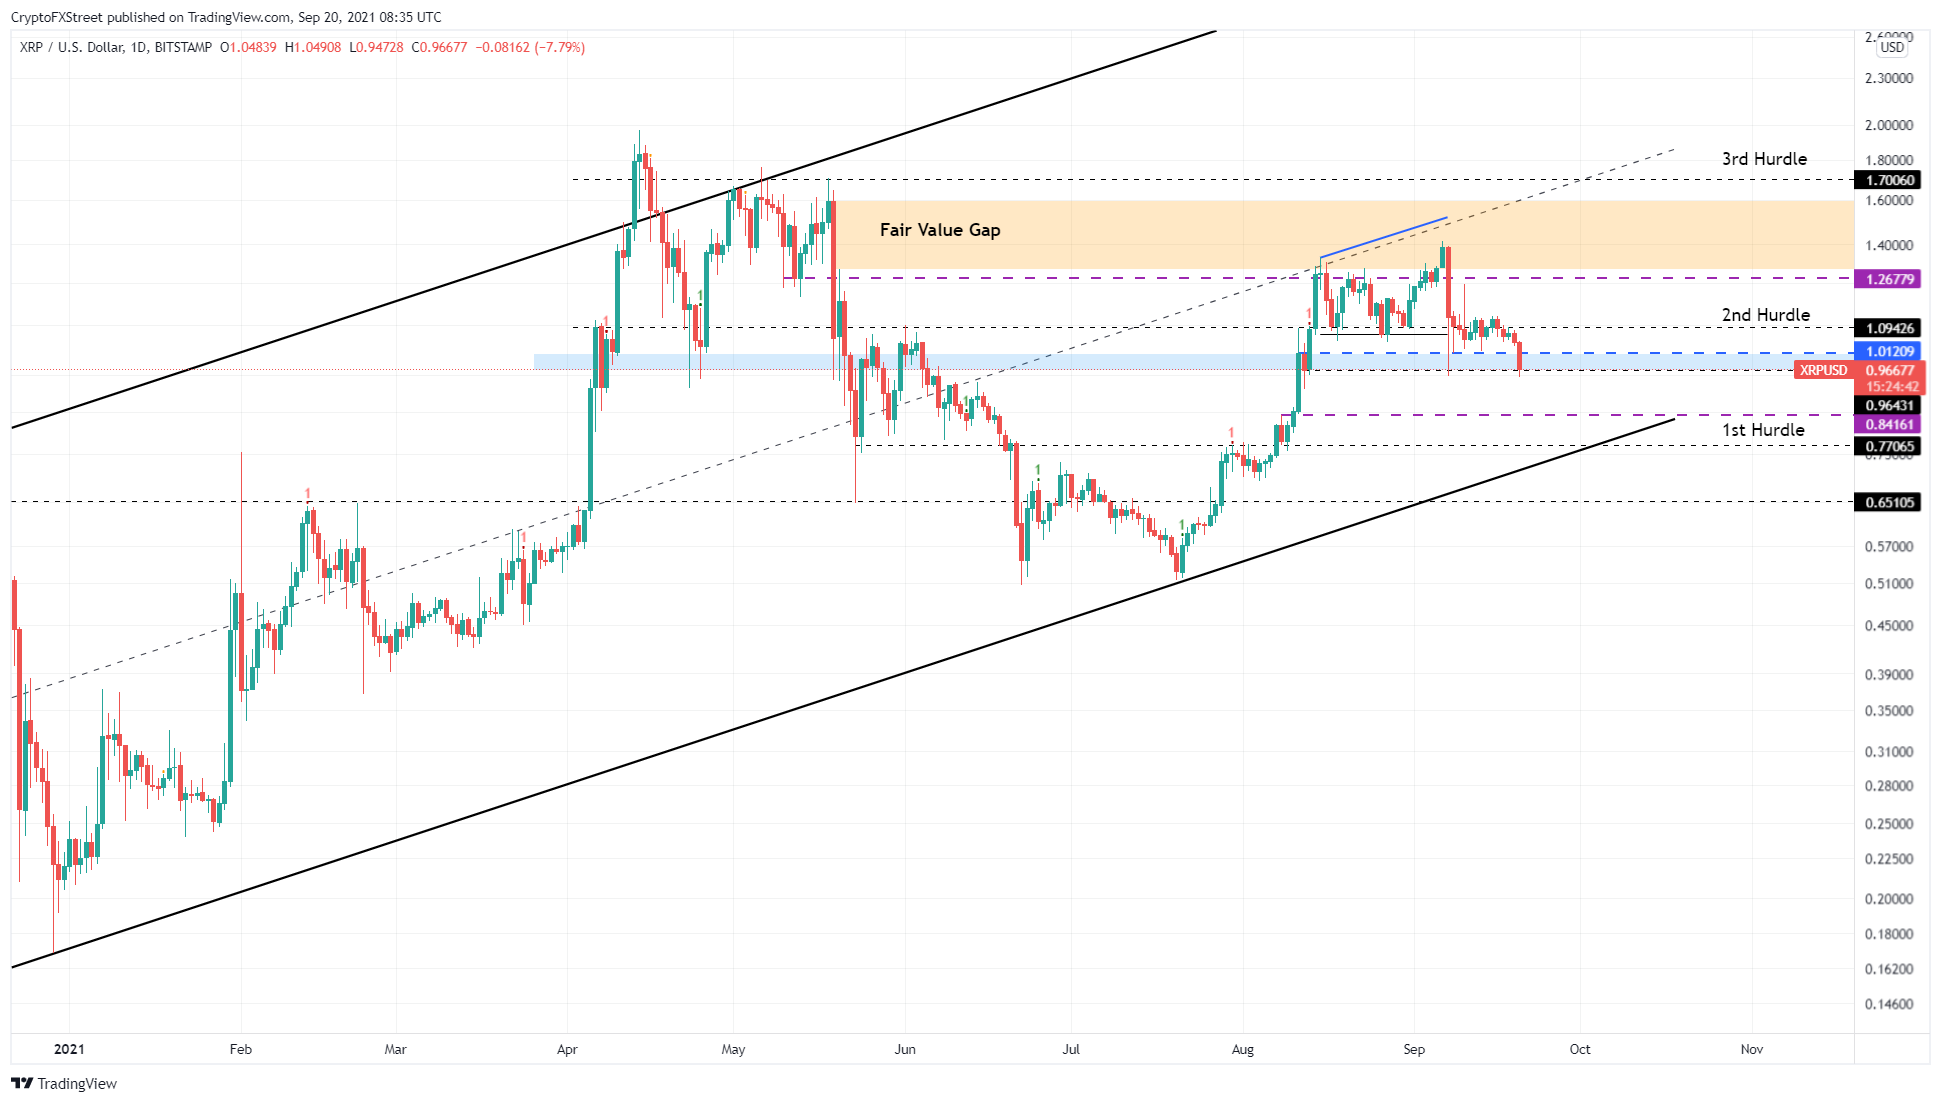
XRP price set up a swing high on August 15 and breached this local top to create a new one on September 6. However, the second attempt failed as the market experienced massive selling pressure the next day. Now, Ripple is continuing to head lower with no signs of recovery.
Technicals hinted at the crash two weeks ago
XRP price was on a roll as it rallied from $0.95 to $1.35 between August 13 and August 15. This run-up brought the uncertain and hesitant investors out of the woodwork as Ripple crashed 18% to $1 over the following weeks.
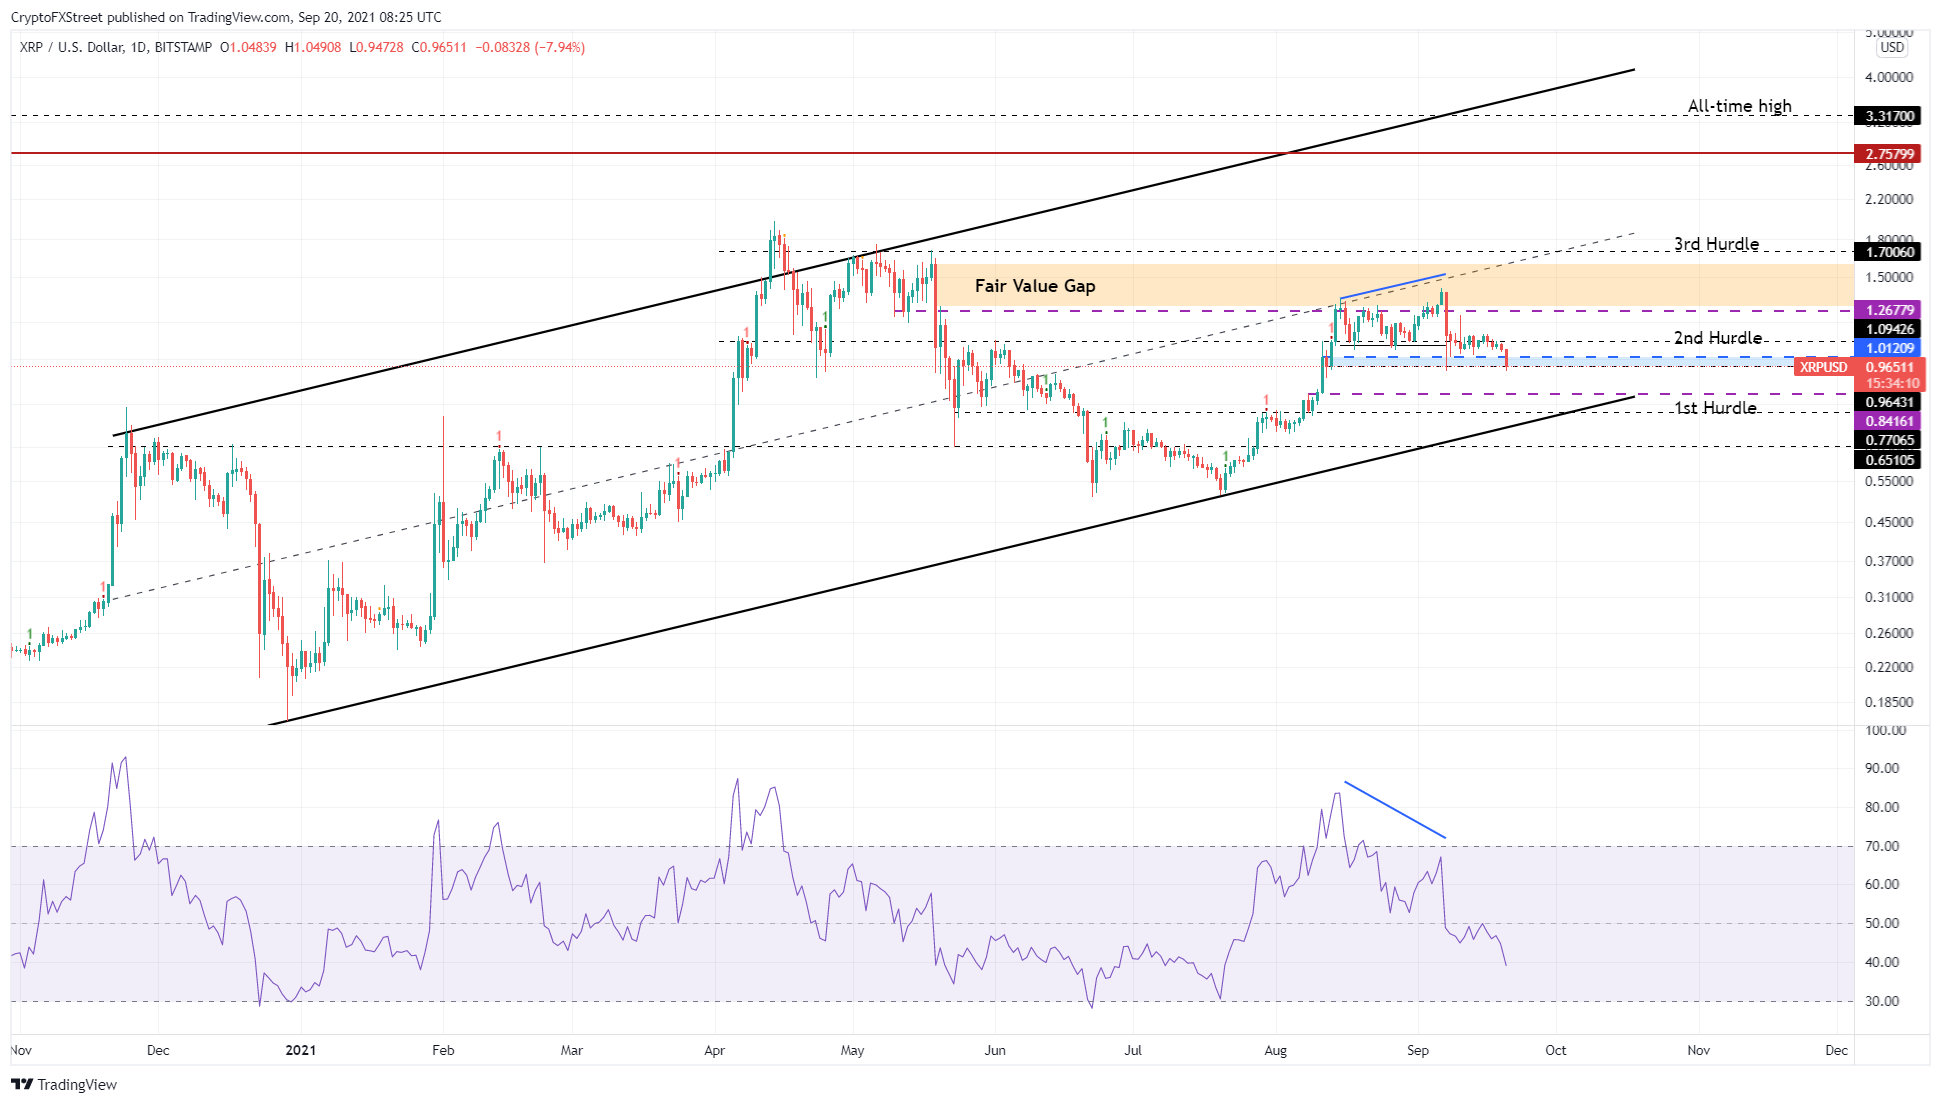
The greedy buyers pushed XRP price to set up a swing high at $1.41, well above the August 15 swing high at $1.35. While traders continued to leverage long XRP, the relative strength index (RSI) was forming a lower low during the August 15 and September 6 peaks, resulting in a bearish divergence.
This is perhaps one of the most important reasons why the XRP price collapsed massively on September 7. While this event coincided with El Salvador airdropping $30 worth of BTC to each of its citizens who downloaded a state-sanctioned wallet, the technical aspects were hinting at the overextended nature of the uptrend and suggested a crash was on its way.
As a result, the XRP price crashed 33% on September 7, and so did Bitcoin and most of the altcoins. Over the weekend, things seemed bullish as the market rallied higher, but this was an ephemeral event.
XRP/USD 1-day chart
The second and equally significant reason is the recent breakdown of a stable support floor. XRP price sliced through the demand zone ranging from $0.96 to $1.01 as markets dropped today. This stretch of barrier is crucial since it has been relevant since early April. Therefore, breaking below this will flip it into a formidable resistance level, preventing any short-term spikes in buying pressure to reclaim it.
Additionally, there is still a massive gap between the current position of RSI and the oversold zone, suggesting that the remittance token has not bottomed yet.
XRP/USDT 1-day chart
On-chain metrics add fuel to fire
The number of daily active addresses peaked at around 31,316 by the end of the first week of September. As XRP continues to decline, so does the number of investors interacting with the Ripple blockchain.
On September 17, this metric created a lower high at 28,761, representing an 8.15% decline over the course of 11 days.
This decrease indicates that the market participants are uninterested in the prospects of XRP price right now and are likely converting/selling their holdings, leading to a downtrend.
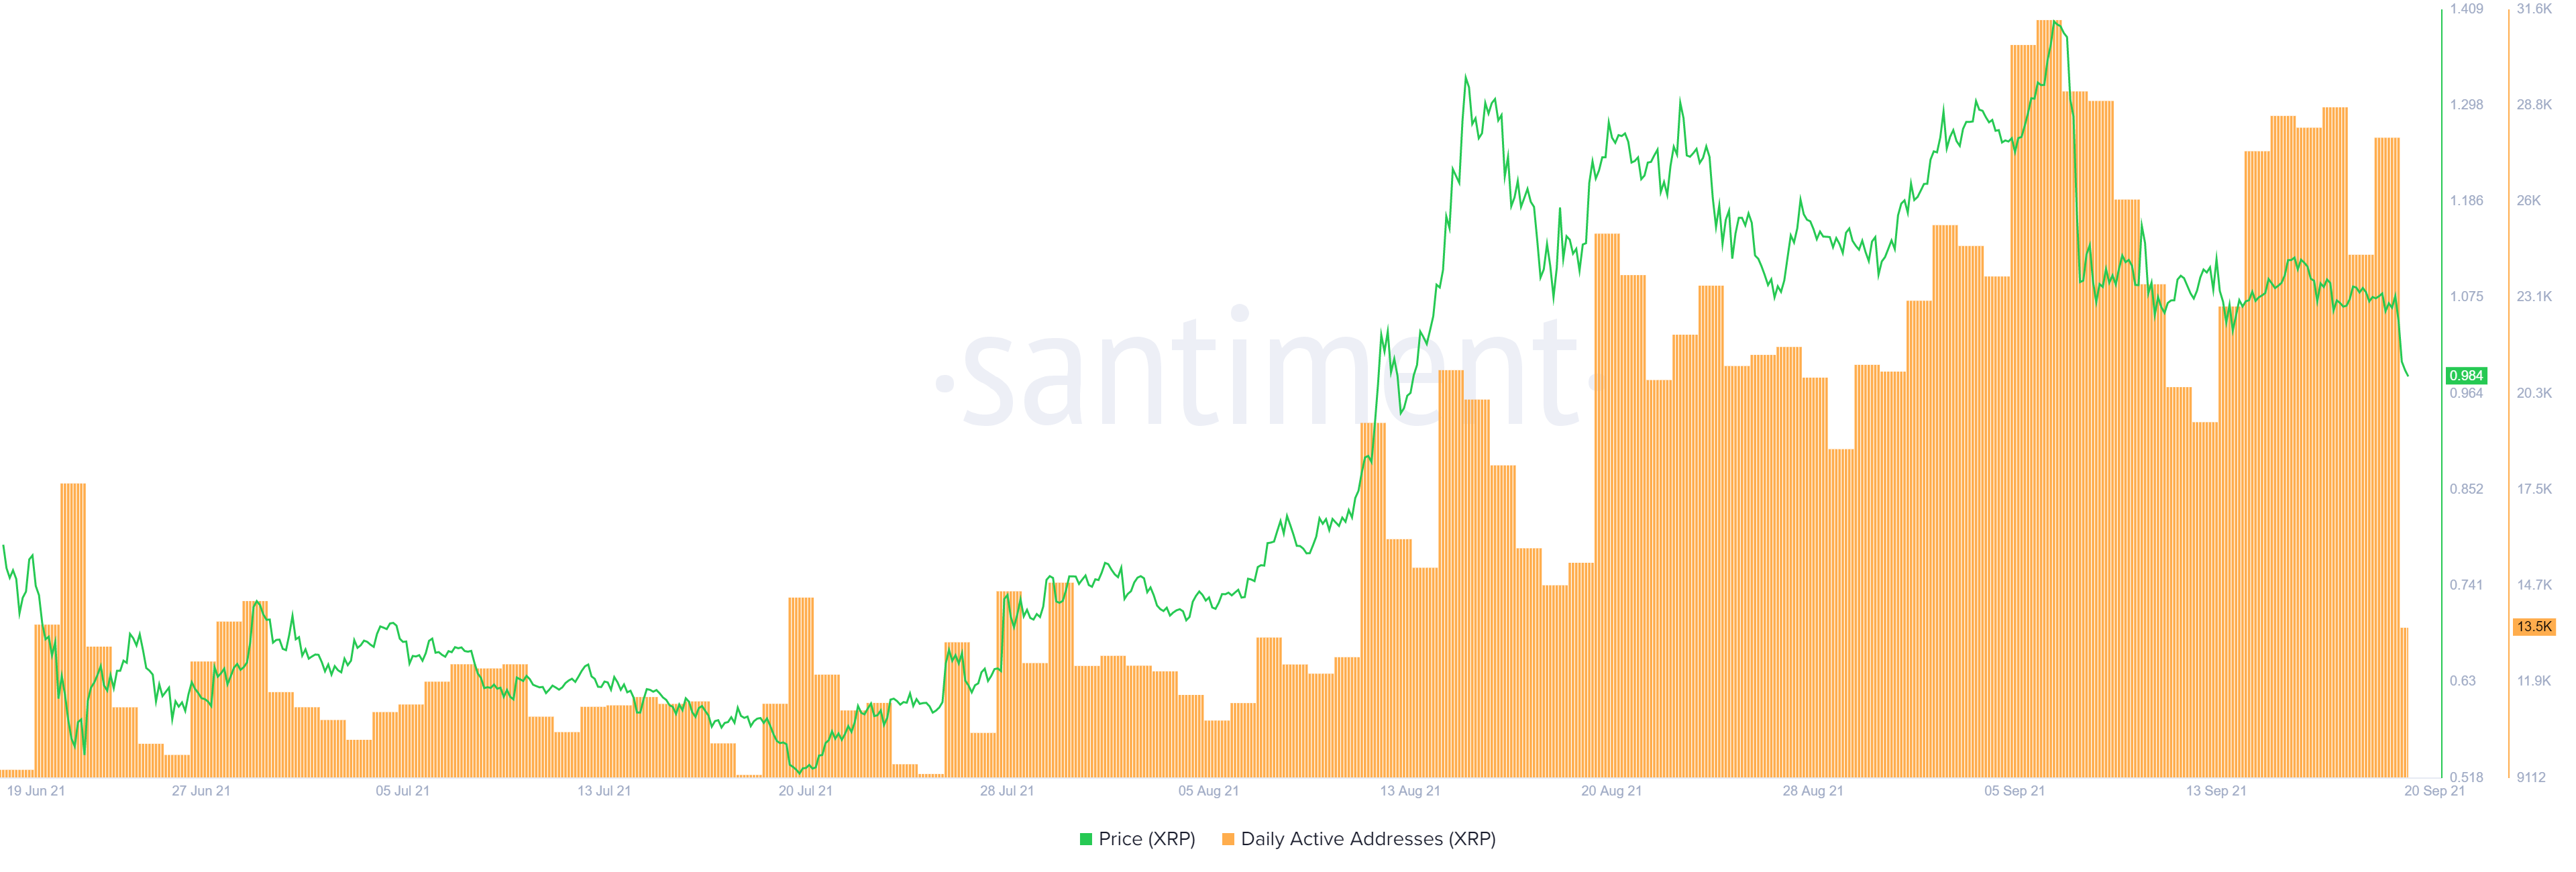
XRP daily active addresses chart
In addition to technicals, the 365-day Market Value to Realized Value (MVRV) model also indicated that a sell-off was nigh. This fundamental index is used to identify the average profit/loss of holders who purchased XRP over the past year.
Before September 6, this number was extremely high at 86%, indicating that investors might book profit and hence cause a downswing.
Therefore, a decisive daily candlestick close below $0.96 will indicate a flip of this level into a resistance barrier. In such a case, market participants can expect the XRP price to sell off 12% to retest the $0.84 support floor. Here, the XRP price might retest the lower trend line of the parallel channel.
In some cases, exacerbation of the downswing might lead to a breakdown of this level and a retest of the next platform at $0.77, coinciding with the lower trend line of the parallel channel.
An increased selling pressure here might result in a crash similar to the one witnessed on September 7, knocking XRP price down to $0.65.
This descent from the current position to $0.65 would constitute a 30% downswing.
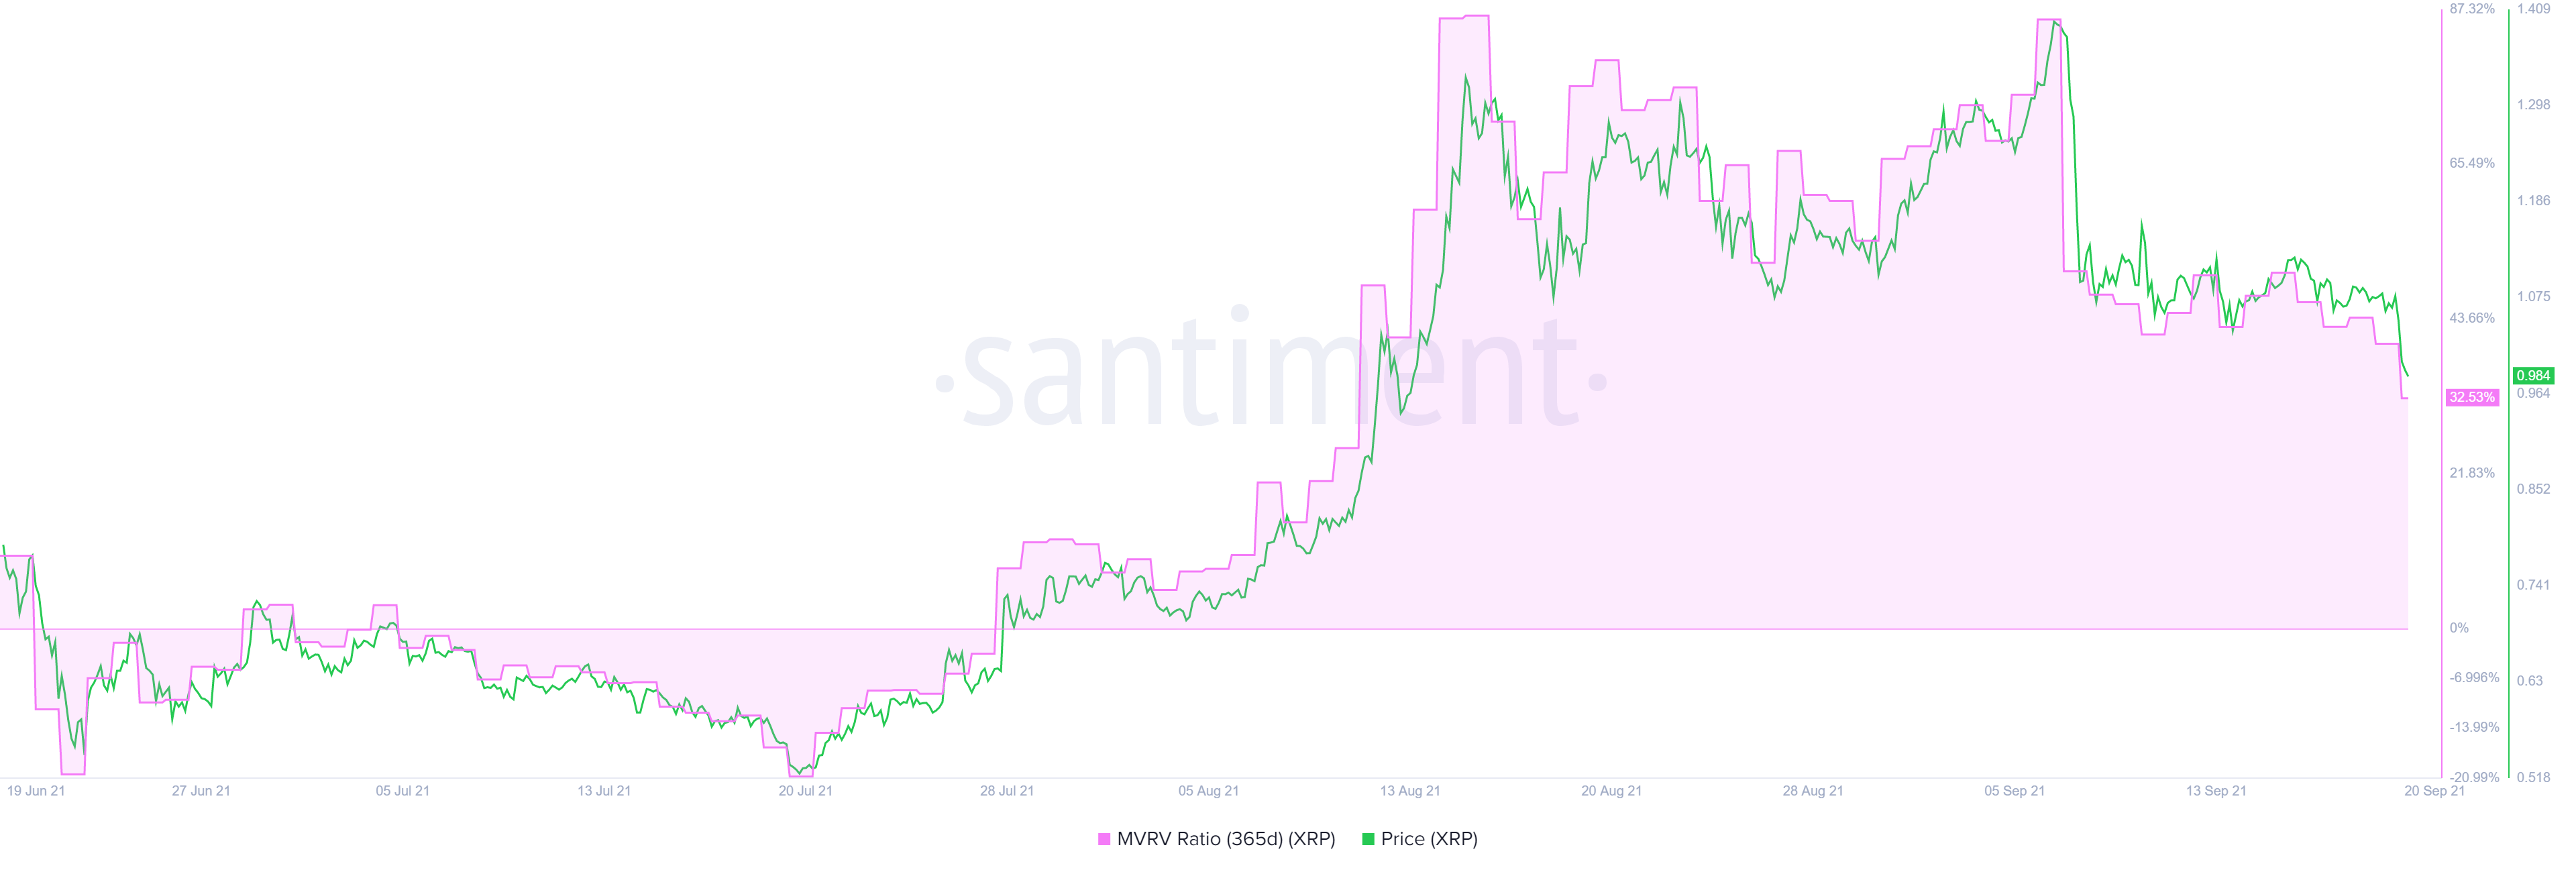
XRP 365-day MVRV chart
On the other hand, if the remittance token manages to reclaim the demand zone ranging from $0.96 to $1.01, it will indicate the resurgence of buyers. A decisive close above $1.09 will serve as initial confirmation of the start of a new uptrend.
However, only a higher high above the September 6 swing high at $1.42 will invalidate the bullish thesis and kick-start a new rally. In this case, Ripple could continue to climb and tag the Fair Value Gap’s (FVG) upper limit at $1.60.
Author

Akash Girimath
FXStreet
Akash Girimath is a Mechanical Engineer interested in the chaos of the financial markets. Trying to make sense of this convoluted yet fascinating space, he switched his engineering job to become a crypto reporter and analyst.


