XRP price crash incoming as support weakens
- XRP price faces significant downside pressure on its Point and Figure Chart.
- Triple-bottom pattern short entry setup warns of a big drop.
- -20% move eyed by bears.

XRP price faces a substantial move to the south if support does not hold. The near-term support on the $0.02/3-box reversal Point and Figure chart is the triple-bottom at $1.04. If XRP bulls fail to hold $1.40, look out below.
XRP price faces return to sub $1.00 trading levels, $0.70 eyed as next price target for bears
XRP price has an interesting setup on its Point and Figure chart. One of the most sought-after patterns in Point and Figure is the triple bottom/top. That pattern itself is potent and has a high positive expectancy rate. However, what makes the triple-bottom on the XRP price chart is how it formed - the third bottom as it crossed below the prior bull market trend line. Utilizing the horizontal or vertical profit target method in Point and Figure analysis shows a target zone of $0.70 from an entry at $1.02.
The current bearish setup will be invalidated if the XRP price moves above the new bear market trendline at $1.22. However, the move that would need to occur for XRP price to achieve $1.22 would need to be powerful and the total inverse of a flash crash. An early warning sign that XRP may begin another uptrend is a close at $1.18, which would put XRP above its daily Tenkan-Sen and Kijun-Sen.
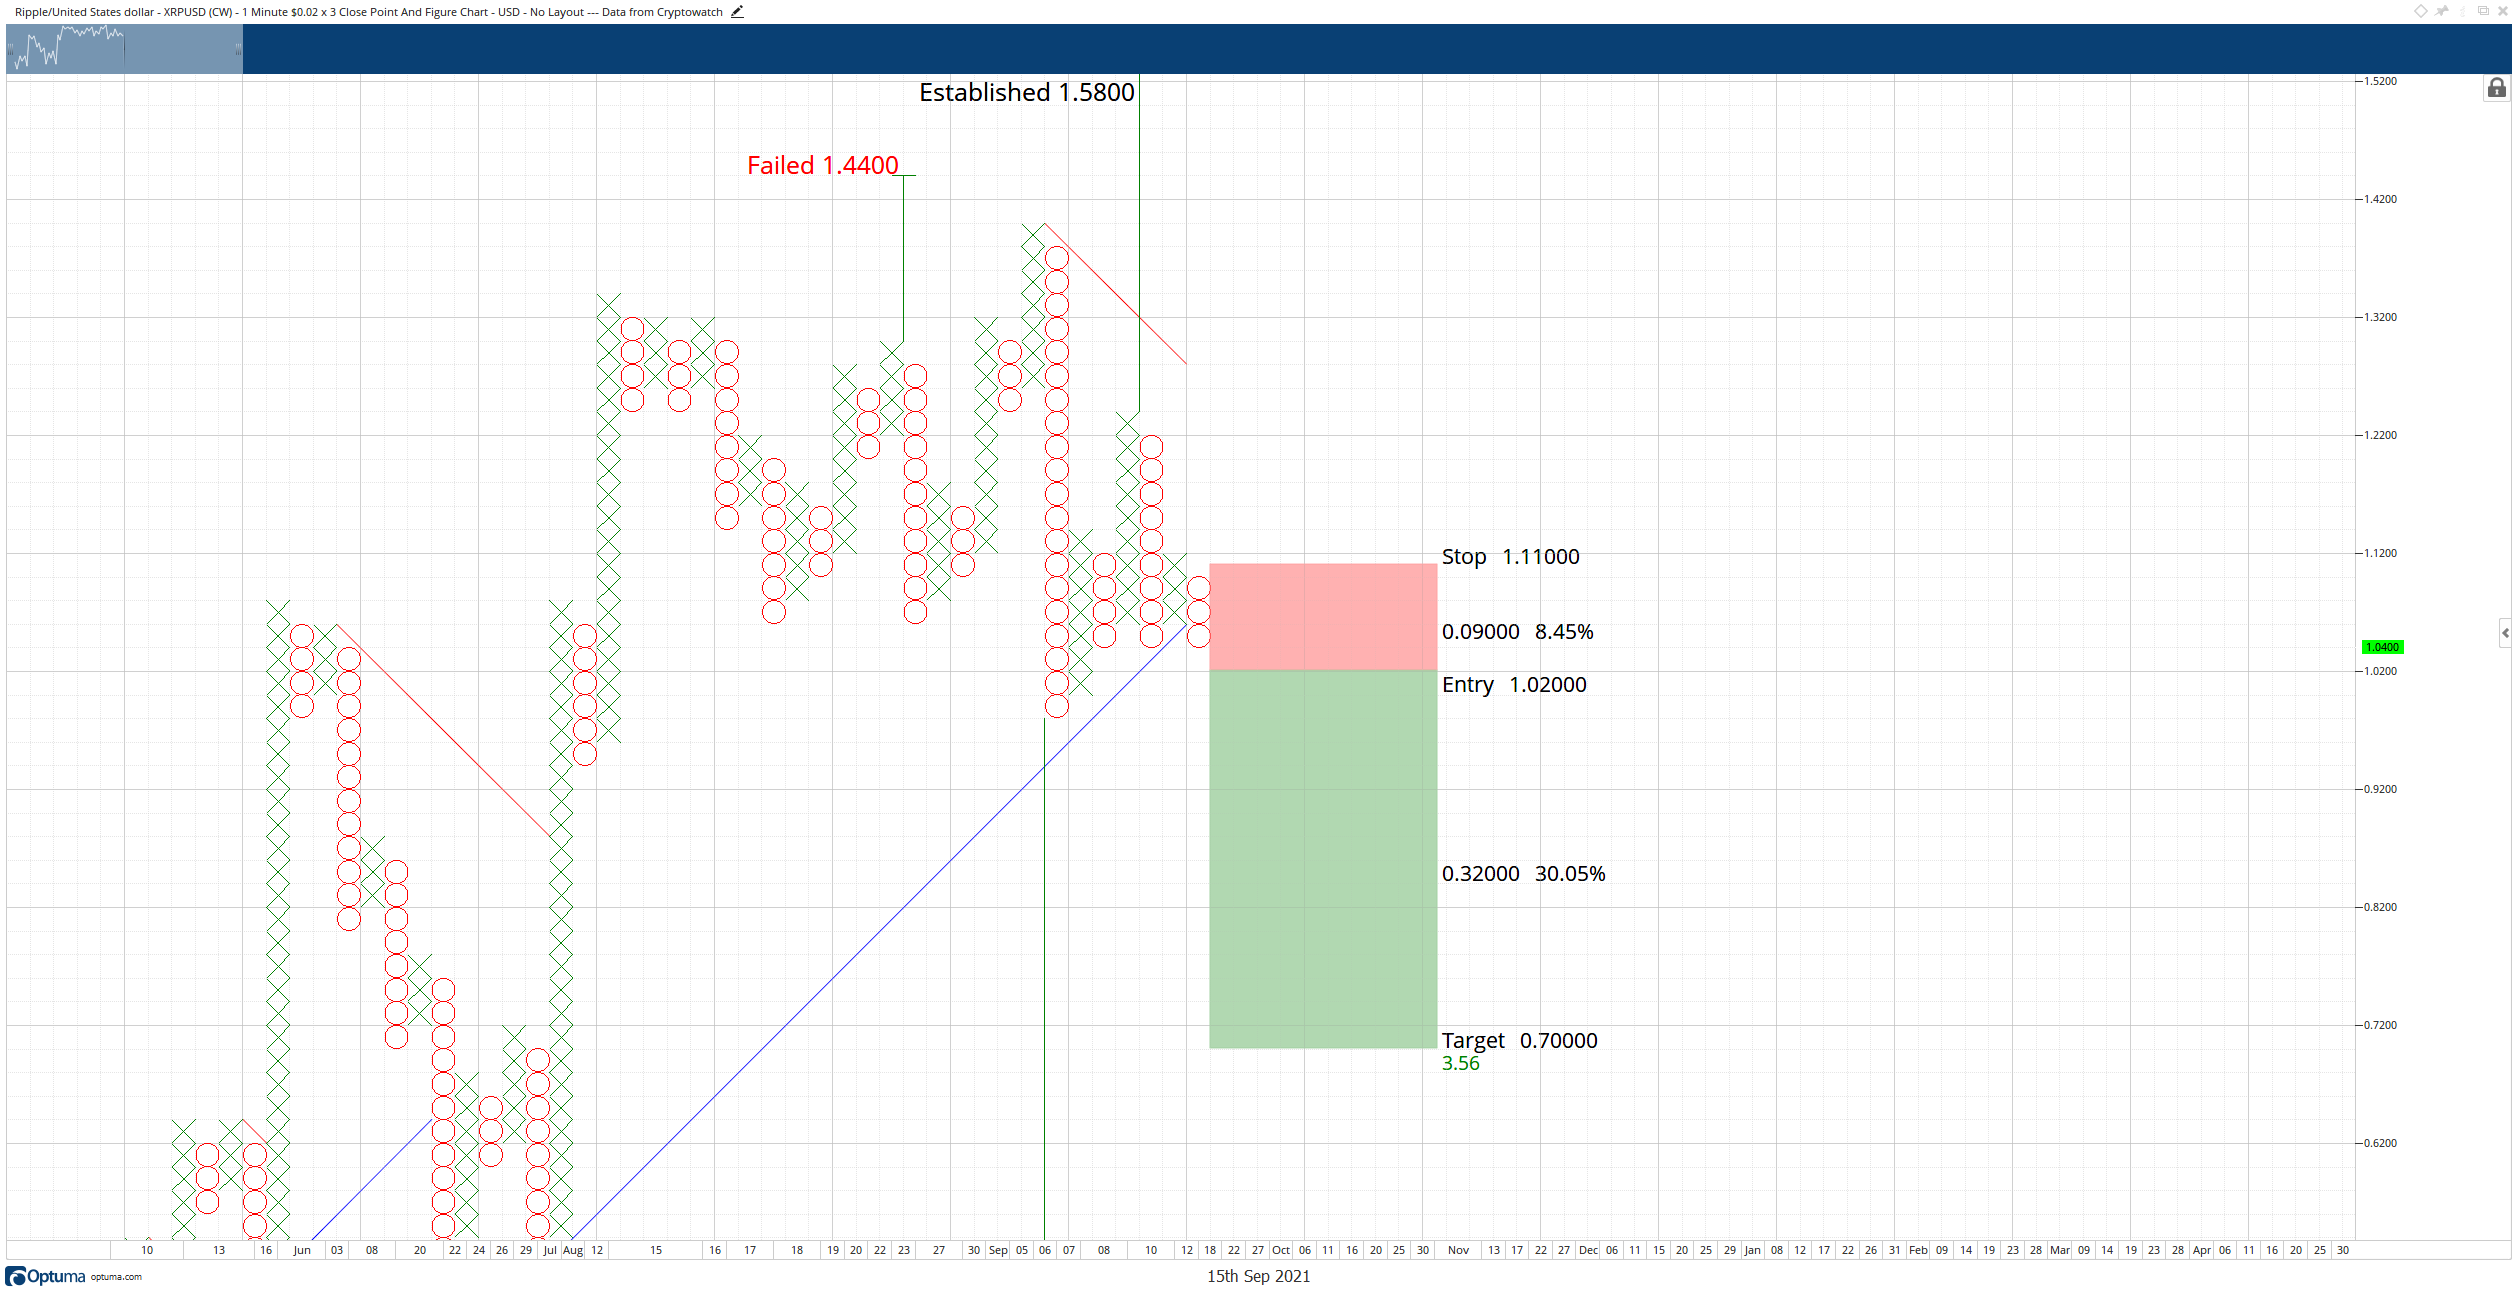
XPR/USD $0.02/3-box Reversal Point and Figure Chart
The daily Relative Strength Index, Composite Index, and Optex Bands all show very neutral conditions, which indicate any major breakout is likely to have a sustained move in the direction of the break.
Bears are favored for a drop here due to the continued consolidation from the flash crash that occurred on September 7th.
Author

Jonathan Morgan
Independent Analyst
Jonathan has been working as an Independent future, forex, and cryptocurrency trader and analyst for 8 years. He also has been writing for the past 5 years.


