FLOKI price is poised for a rally after breaking above the descending trendline
- FLOKI price breaks above the descending trendline, with an impending rally ahead.
- On-chain data shows that FLOKI's dormant wallets are active, signaling a bullish move ahead.
- A daily candlestick close below $0.00011 would invalidate the bullish thesis.

FLOKI (FLOKI) price broke above the descending trendline and rallied 10%. At the time of writing on Wednesday, it continued its ongoing rally and trades 4.4% at $0.00015. Additionally, the suggestion of on-chain data supports the bullish trend, as evidenced by active, dormant wallets.
FLOKI price shows potential for a rally after descending trendline break
FLOKI's price broke above the descending trendline (drawn by connecting multiple high levels from June 7) on August 22 and rallied 10% the next two days. On Wednesday, it finds support at the 50-day Exponential Moving Average (EMA) of around $0.00014 and trades up by 4.4% at $0.00015.
If the 50-day EMA at $0.00014 and the daily support level at $0.00013 hold as support, FLOKI could rally 24% from its current trading level at $0.00015 to retest its July 27 high of $0.00018.
On the daily chart, this bounce is supported by indicators like the Relative Strength Index (RSI) and Awesome Oscillator (AO), which trade comfortably above their respective neutral levels of 50 and zero. These momentum indicators strongly indicate bullish dominance.
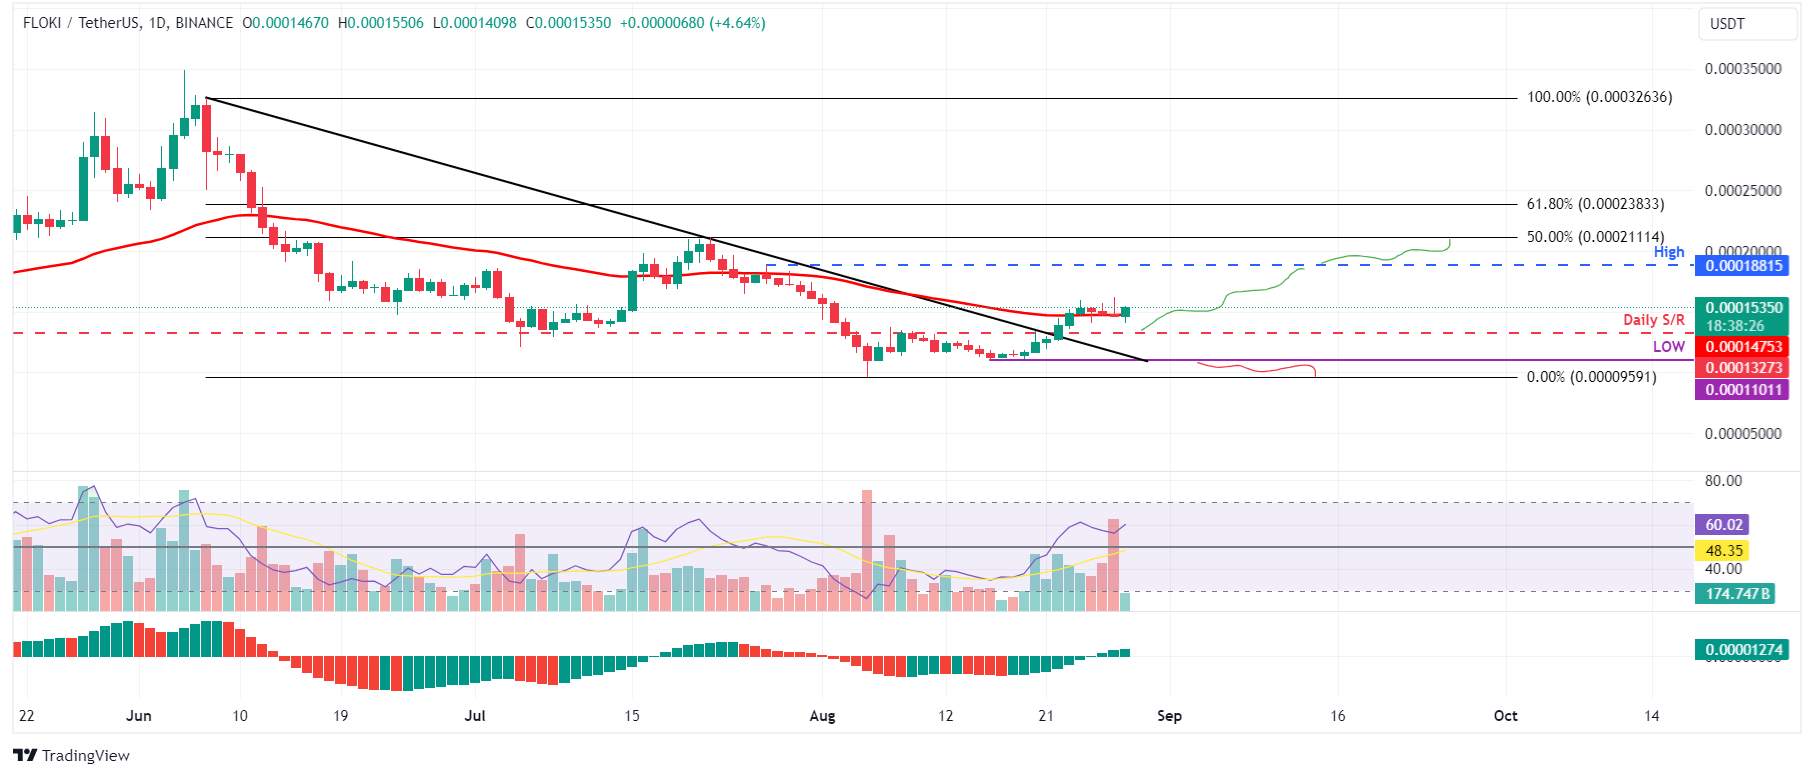
FLOKI/USDT daily chart
Based on IntoTheBlock's In/Out of the Money Around Price (IOMAP), nearly 826 addresses accumulated 9.82 billion FLOKI tokens at an average price of $0.000143. These addresses bought the dog-based meme token between $0.000141 and $0.000143, which makes it a key support zone.
Interestingly, the zone mentioned from a technical analysis perspective, the $0.000143 level, coincides with the IOMAP findings, making this zone a key reversal area to watch.
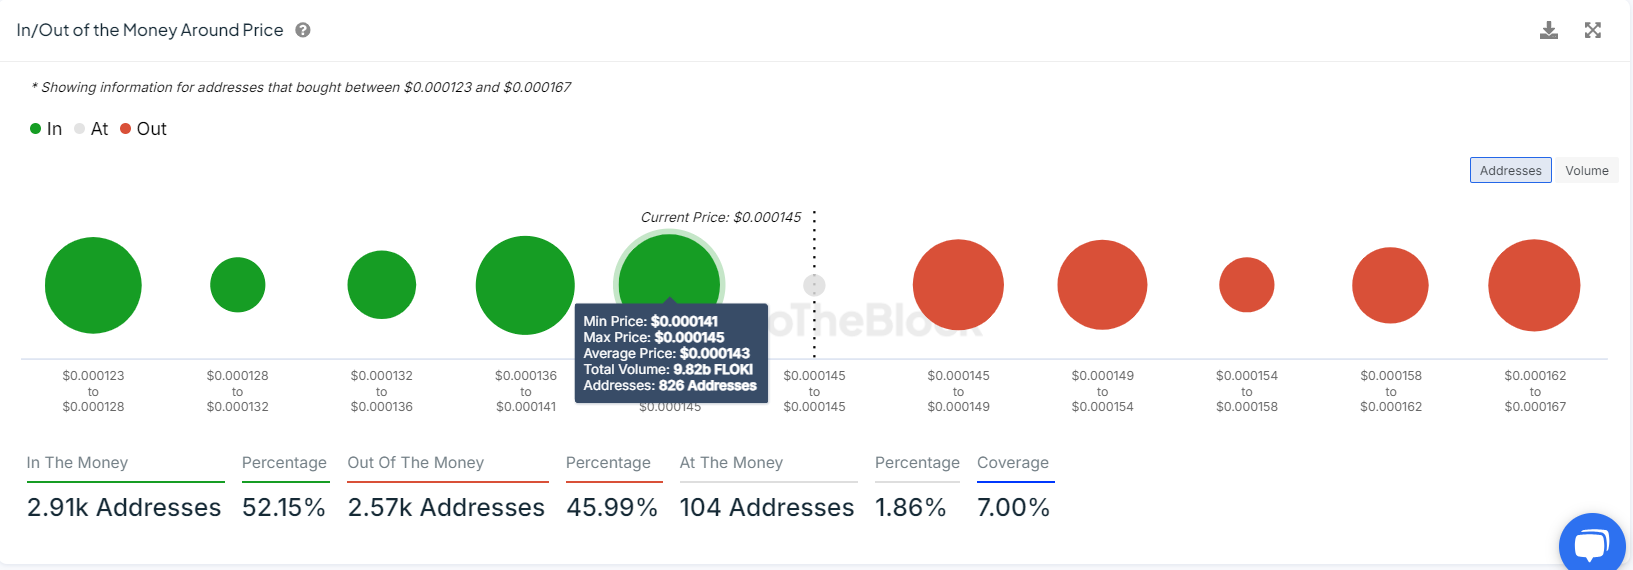
FLOKI IOMAP chart
Santiment's Age Consumed index aligns with the bullish outlook from a technical perspective. The spikes in this index suggest dormant tokens (tokens stored in wallets for a long time) are in motion and can be used to spot short-term local tops or bottoms.
For FLOKI, history shows that the spikes were followed by a rally in FLOKI price. The most recent uptick on August 20 also forecasted that FLOKI was ready for an uptrend.
%20[09.47.24,%2028%20Aug,%202024]-638604209330474348.png)
FLOKI Age Consumed chart
Despite promising technical analysis and on-chain data, a lower low would be formed if the daily candlestick closes below the $0.00011 price level. This scenario would flip the bullish market structure to bearish, which could cause the FLOKI price to crash 14% to retest the August 5 low of $0.000095.
Author

Manish Chhetri
FXStreet
Manish Chhetri is a crypto specialist with over four years of experience in the cryptocurrency industry.




