Bitcoin price dips below $63,000 despite bullish on-chain metrics, ETF inflows
- Bitcoin price approaches 200-day EMA support area of around $62,000 and could expect a bounce.
- US spot Bitcoin ETFs recorded inflows of $200.04 million on Monday.
- On-chain data shows negative exchange netflow and the long-to-short ratio above one, further giving chances for a bullish move.

Bitcoin (BTC) continues to retrace on Tuesday after declining by 2.2% on Monday as it faced rejection around the daily resistance level of $65,400. The largest crypto asset trades near its 200-day Exponential Moving Average (EMA) around $62,000, a level from which it could stage a rebound supported by technical analysis and positive on-chain data such as a negative exchange netflow and a long-to-short ratio above one.
Daily digest market movers: Bitcoin US spot ETFs record inflows
- Coinglass's US spot Bitcoin ETFs data shows an inflow of $200.4 million on Monday. The spot EFTs have seen continuous inflows since August 15, the longest streak of gains since mid-July. Monitoring these ETFs' net flow data is crucial for understanding market dynamics and investor sentiment. The combined Bitcoin reserves held by the 11 US spot Bitcoin ETFs stand at $46.90 billion.
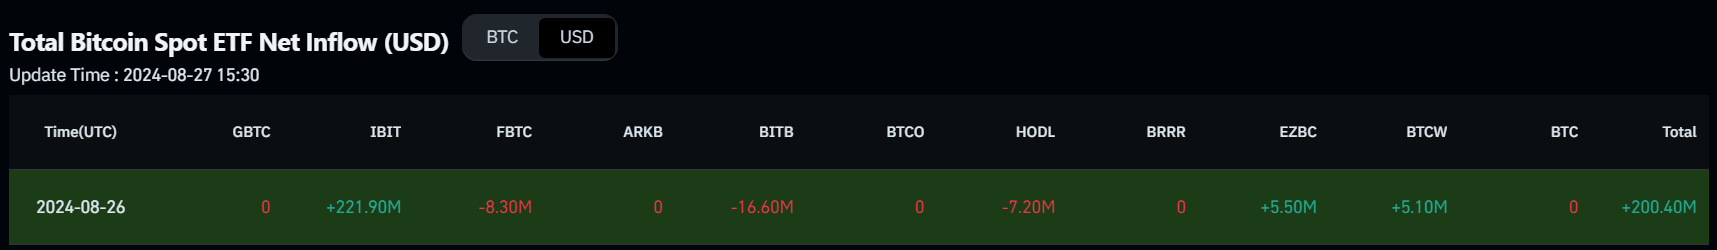
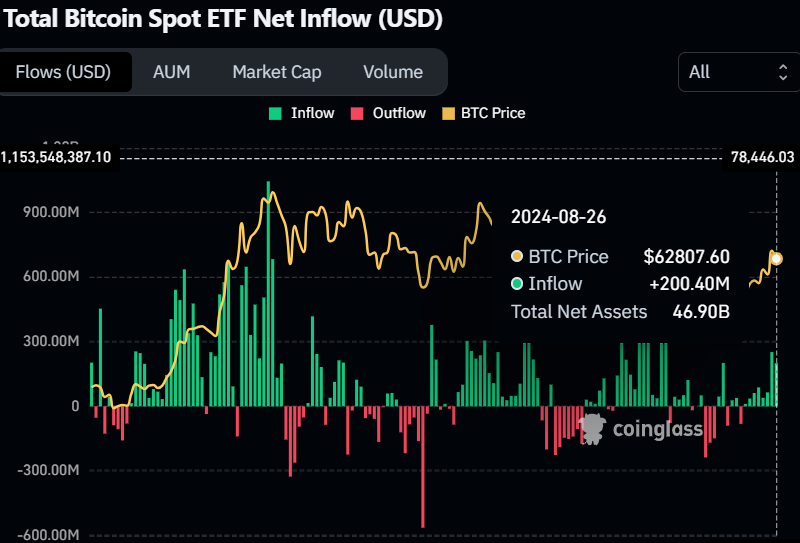
Bitcoin Spot ETF Net Inflow chart
- CryptoQuant Exchange Netflow data shows the difference between coins flowing into and out of exchanges. An increase in exchange inflows (a positive value) is mostly bearish, while the increase in outflows from exchanges (negative value) is mostly bullish. In BTC's case, the netflow shows -45,500 BTC on Monday, indicating that 45,500 BTC were removed from exchanges and stored in the holders' wallets, suggesting buying activity and reducing selling pressure.
%20-%20All%20Exchanges-638603585109047866.png)
BTC Exchange Netflow chart
- According to Coinglass's data, BTC's Binance long-to-short ratio is 1.33. This ratio reflects bullish sentiment in the market, as a number above one suggests that more traders anticipate the price of the asset to rise.
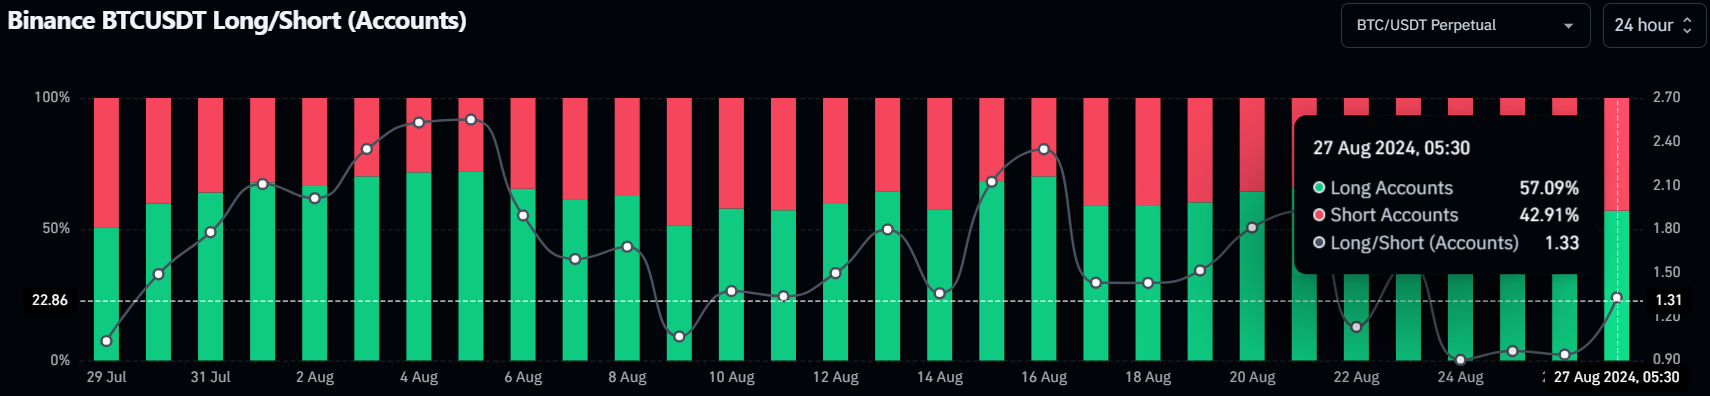
Binance BTC long-to-short ratio chart
Technical analysis: BTC price could rally if it retests 200-day EMA
Bitcoin price faced a pullback at around the daily resistance level of $65,379 on Sunday, declining 2.2% on Monday. At the time of writing on Tuesday, it continues to retrace down by 0.6% at $62,416.
If BTC continues to retrace, it could find support at the 200-day Exponential Moving Average (EMA) at $62,267.
If BTC bounces off $62,042, it could rise to $65,379 before potentially rallying by 7% to restest its July 29 high of $70,079.
This bounce is supported by indicators like the Relative Strength Index (RSI) and Awesome Oscillator (AO) on the daily chart, which sit comfortably above their respective mean levels of 50 and zero. These momentum indicators signal indecisiveness among investors.
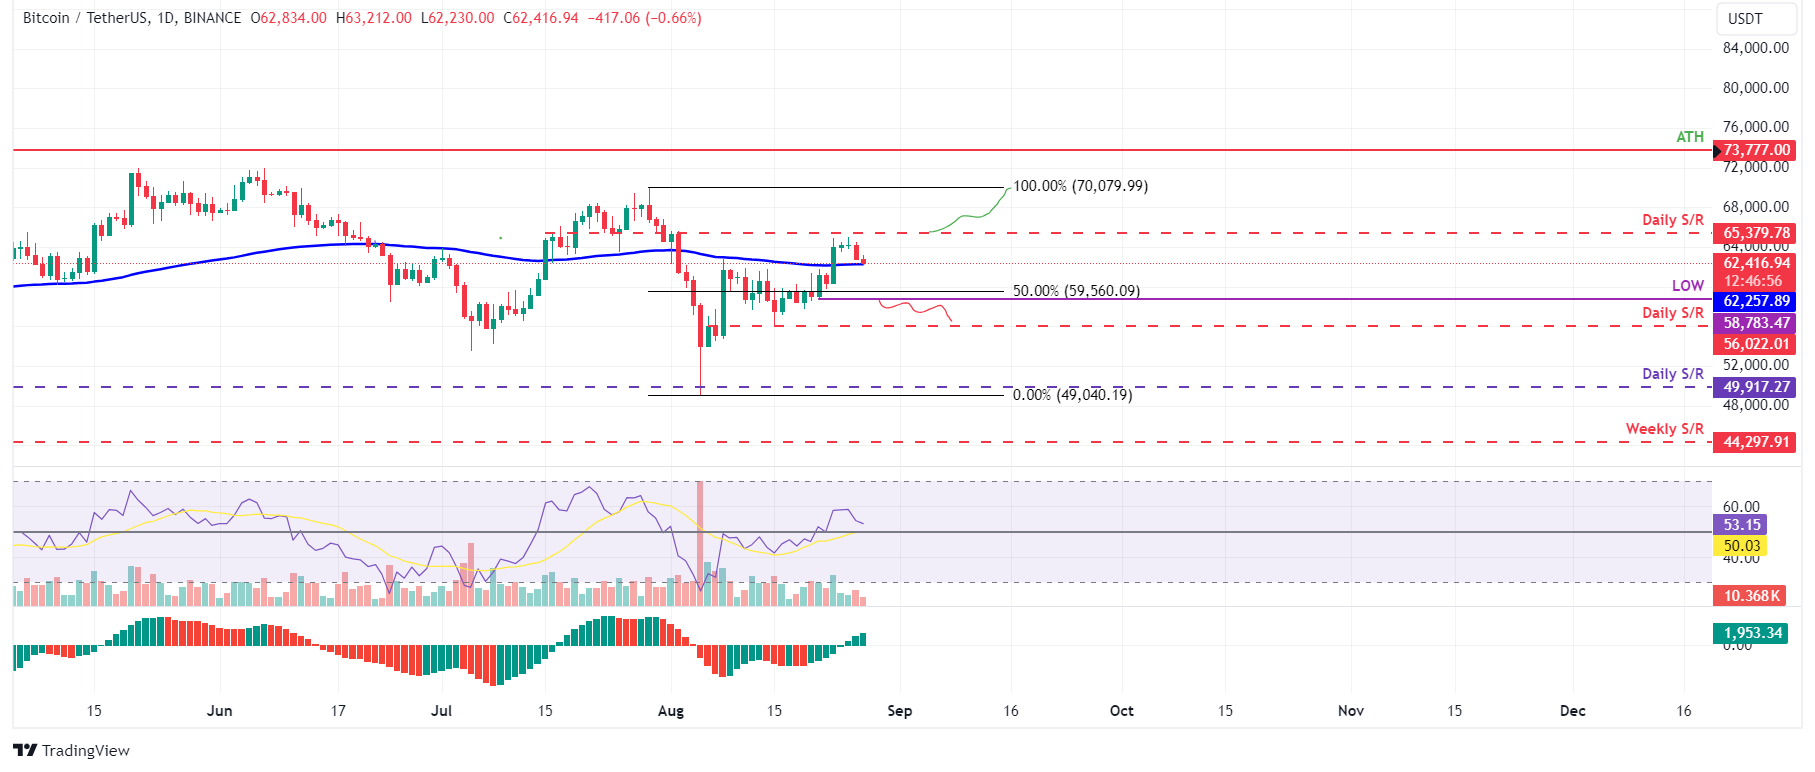
BTC/USDT daily chart
However, if Bitcoin's price closes below the August 21 low of $58,783, a 5% decline towards daily support at $56,022 would be on the cards as it would set a lower low on the daily chart. This scenario would invalidate the bullish thesis.
Bitcoin, altcoins, stablecoins FAQs
Bitcoin is the largest cryptocurrency by market capitalization, a virtual currency designed to serve as money. This form of payment cannot be controlled by any one person, group, or entity, which eliminates the need for third-party participation during financial transactions.
Altcoins are any cryptocurrency apart from Bitcoin, but some also regard Ethereum as a non-altcoin because it is from these two cryptocurrencies that forking happens. If this is true, then Litecoin is the first altcoin, forked from the Bitcoin protocol and, therefore, an “improved” version of it.
Stablecoins are cryptocurrencies designed to have a stable price, with their value backed by a reserve of the asset it represents. To achieve this, the value of any one stablecoin is pegged to a commodity or financial instrument, such as the US Dollar (USD), with its supply regulated by an algorithm or demand. The main goal of stablecoins is to provide an on/off-ramp for investors willing to trade and invest in cryptocurrencies. Stablecoins also allow investors to store value since cryptocurrencies, in general, are subject to volatility.
Bitcoin dominance is the ratio of Bitcoin's market capitalization to the total market capitalization of all cryptocurrencies combined. It provides a clear picture of Bitcoin’s interest among investors. A high BTC dominance typically happens before and during a bull run, in which investors resort to investing in relatively stable and high market capitalization cryptocurrency like Bitcoin. A drop in BTC dominance usually means that investors are moving their capital and/or profits to altcoins in a quest for higher returns, which usually triggers an explosion of altcoin rallies.
Author

Manish Chhetri
FXStreet
Manish Chhetri is a crypto specialist with over four years of experience in the cryptocurrency industry.


