Ethereum price stays in limbo while whales ramp up selling activities
- Ethereum price holds firmly to support at $1,250.
- Ethereum whales are not slowing down their selling spree nearly three weeks after the Merge.
- A sustained break above the falling channel’s throughline may help improve investor sentiment for a move to $2,000.

Ethereum price may have slowed down its downtrend, but it’s still wallowing deeply in murky waters. With robust support between $1,200 and $1,300 in place, the largest smart contracts token is focusing on closing the day above $1,400. However, bulls still have a long way to go, especially as they fight the seller congestion at $1,350.
Are the whales’ selling activities holding Ethereum price from rallying?
Ethereum price started losing ground a few days before its software upgrade event called the Merge. On-chain data by Glassnode shows that large volume investors greatly contributed to the selling pressure.
The number of addresses with 1,000 and more ETH had dropped to 6,356 on September 22, several days after peaking at 6,516. Moreover, the chart below elucidates that these whale addresses are yet to stop dumping. Currently, there are 6,329 addresses in this cohort.
-638004887886684337.png)
Ethereum Number of Addresses with Balance ≥ 1k
Despite Ethereum price confirming support between $1,200 and $1,300, it has not made any significant progress to the upside. Pressure from the whale addresses above may be keeping ETH from making northbound strides to $2,000.
On the other hand, bulls are generally in control but lack the momentum to sustain movement above the falling channel’s middle boundary resistance at $1,350. A closer look at the MACD (Moving Average Convergence Divergence) points at an incoming buy signal.
Buyers must wait for the 12-day EMA (Exponential Moving Average – red) to cross above the 26-day EMA (blue) before confirming buy orders. The MACD’s movement above the mean line (0.00) could validate the Ethereum price uptrend.
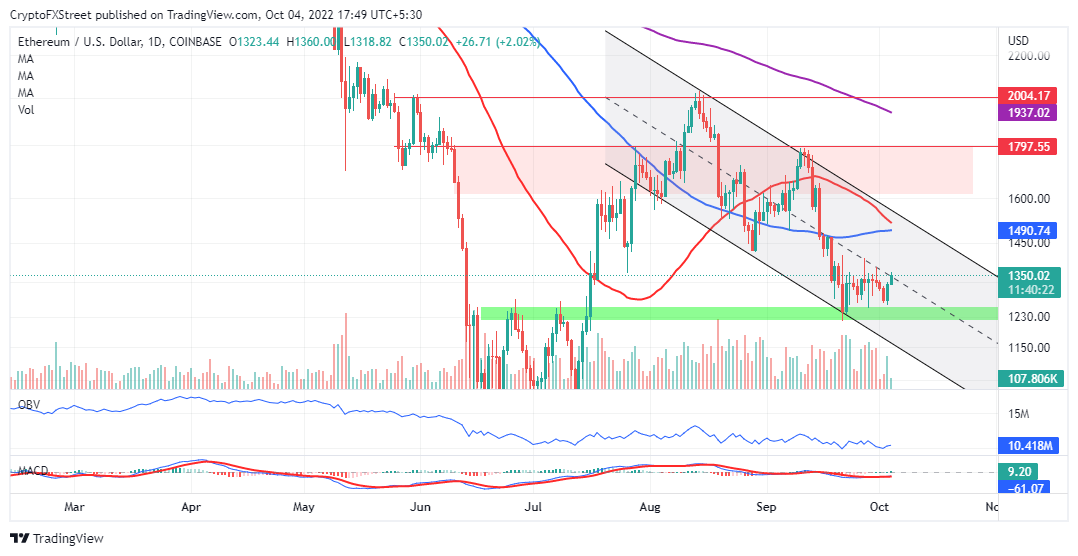
ETH/USD daily chart
The OBV (On Balance Volume) is another crucial tool traders can use to confirm if the market has the potential to keep going up. It uses the flow of volume to predict changes in asset prices. As the volume swells, the OBV “as a spring being wound tightly,” can point to an incoming breakout.
For now, a break above the channel’s throughline may pave the way for an additional move to $1,400. From here, Ethereum price would be in a better position to climb the ladder to $2,000. Remember that as the price rises, speculation will probably increase across the board – with more buyers betting on a sustained breakout.
Author

John Isige
FXStreet
John Isige is a seasoned cryptocurrency journalist and markets analyst committed to delivering high-quality, actionable insights tailored to traders, investors, and crypto enthusiasts. He enjoys deep dives into emerging Web3 tren


