Ethereum gas fees hit record lows as ETH attempts historical price move
- Ethereum gas fees plunged to an all-time low on Saturday as ETH supply continued its uptrend.
- Global Ethereum ETFs saw minor inflows of $4.2 million last week despite their US counterparts recording over $14 million in outflows.
- Ethereum could repeat historical move after breaching the lower trendline of a key ascending triangle.

Ethereum is down over 3% on Monday after posting weak flows across ETH ETFs and record lows in gas fees last week. The decline also coincides with ETH attempting to repeat a historical price move that it experienced in the last two years.
Daily digest market movers: Ethereum’s low gas fees coincides with weak ETF flows
In the past week, Ethereum's average daily gas fee reached an all-time low of 1.06 Gwei on Saturday, according to data from Ultrasound.money. Gwei is the measure for transaction fees on Ethereum.
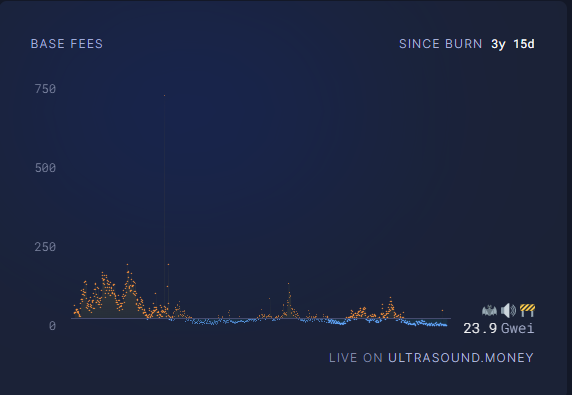
ETH Gas Fees since the London Hard Fork
The reduction in gas fees also meant that the burn rate of ETH dropped to 115 ETH on Saturday, per CryptoQuant's data. While periods of record-low gas fees have often coincided with a price bottom in the past, the market outlook this time may be different due to the Dencun upgrade on March 13.
The Dencun upgrade introduced blobs, which allow Layer 2 networks to post data on the Main chain at significantly lower fees. As a result, ETH's burn rate — meant to offset new issuance — has continued falling.
Between April and August 2024, Ethereum's total supply has increased by over 220,000 ETH, and its price has fallen more than 30%. A sustained uptrend in supply could negatively impact ETH's price if demand declines or stays constant. This may be a potential reason for Ethereum ETFs not yet impacting prices.
Meanwhile, Ethereum ETFs recorded a net inflow of $4.2 million last week, according to CoinShares data. Although global inflows were positive, US spot ETH ETFs took in net outflows of $14.1 million. The weak inflows indicate caution among investors, as evident in choppy price movement and the ETH Fear and Greed Index at 34.
The ETH Fear and Greed Index measures investor sentiment toward Ethereum using values from 0 - 100. A heightened increase in the index suggests high greed, while decreasing values suggest FUD (fear, uncertainty and doubt).
ETH technical analysis: Ethereum poised to repeat key historical price move
Ethereum is trading around $2,570 on Monday, down over 3% on the day. In the past 24 hours, ETH sustained $30.8 million in liquidations, with long and short liquidations accounting for $28 million and $2.8 million, respectively.
Ethereum derivatives market indicates most traders are bearish, considering funding rates turned negative earlier today, according to CryptoQuant's data. Funding rates are periodic payments that long/short traders pay/receive when the price of perpetual futures contracts trades above or below that of its spot counterpart. It's also used as a sort of sentiment indicator to know whether traders are bullish or bearish.
Ethereum's funding rate is hovering around -0.0036 at the time of writing, indicating that short positions are dominant.
The bearish sentiment is also evident on the 4-hour chart, where ETH breached the rising lower trendline of an ascending triangle on Sunday. Such a move indicates that sellers are gaining momentum and could kick-start a dominant bearish trend.
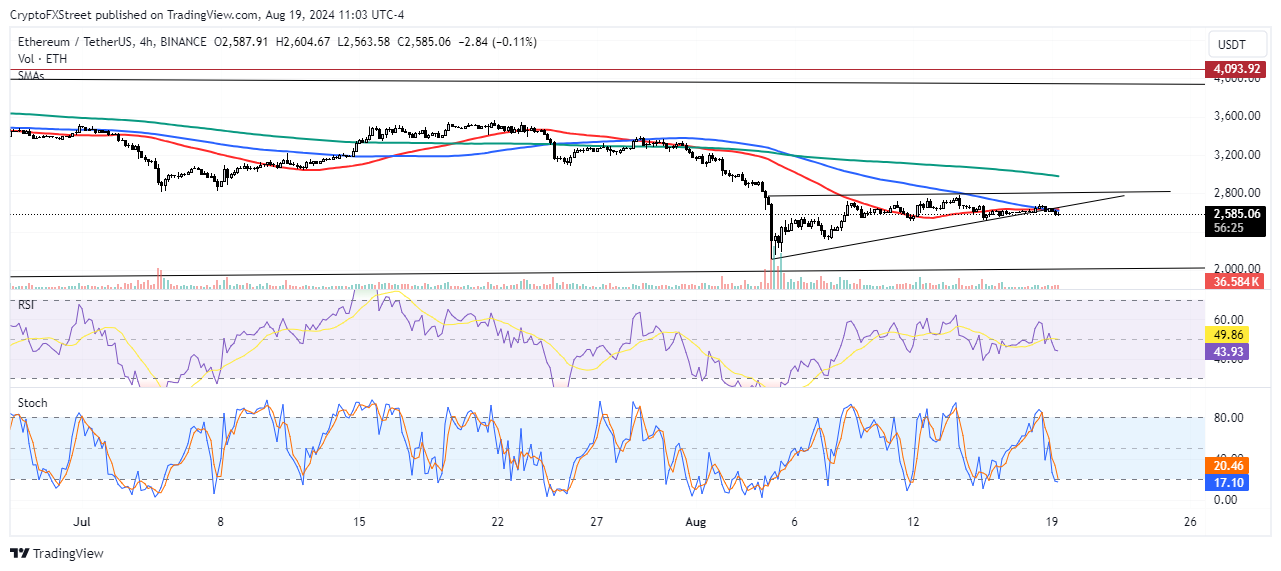
ETH/USDT 4-hour chart
However, the Stochastic Oscillator during this time frame suggests that ETH could see a rebound after falling below the 20 mark and entering the oversold region. On the other hand, the Relative Strength Index (RSI) is signaling a bearish move after moving below its midpoint and moving average.
Meanwhile, ETH continues to face resistance around a descending trendline on the daily chart. The trendline, plotted from May 30 to September 29, suggests ETH may decline to the range of $2,000 to $2,200 in the coming weeks before seeing a major rally.
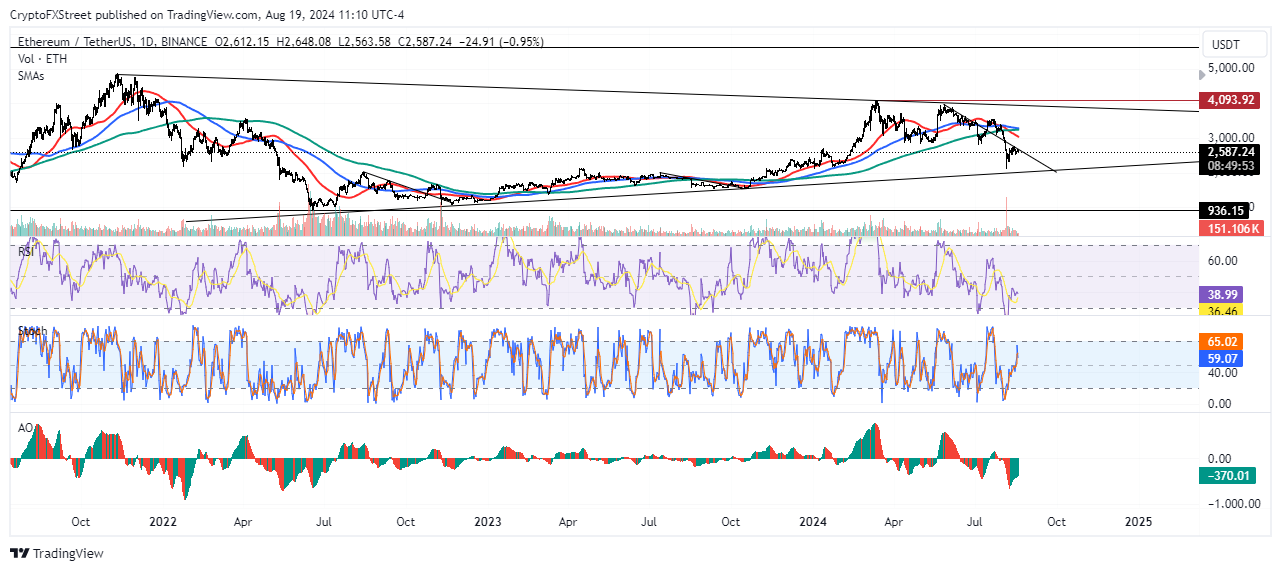
ETH/USDT Daily chart
ETH posted similar moves from August 2022 to November 2022 and July 2023 to October 2023. Additionally, the daily chart's Awesome Oscillator (AO) suggests that the bearish momentum is slowing down.
In the short term, ETH could rise briefly to $2,648 to liquidate positions worth $21.12 million.
Ethereum FAQs
Ethereum is a decentralized open-source blockchain with smart contracts functionality. Serving as the basal network for the Ether (ETH) cryptocurrency, it is the second largest crypto and largest altcoin by market capitalization. The Ethereum network is tailored for scalability, programmability, security, and decentralization, attributes that make it popular among developers.
Ethereum uses decentralized blockchain technology, where developers can build and deploy applications that are independent of the central authority. To make this easier, the network has a programming language in place, which helps users create self-executing smart contracts. A smart contract is basically a code that can be verified and allows inter-user transactions.
Staking is a process where investors grow their portfolios by locking their assets for a specified duration instead of selling them. It is used by most blockchains, especially the ones that employ Proof-of-Stake (PoS) mechanism, with users earning rewards as an incentive for committing their tokens. For most long-term cryptocurrency holders, staking is a strategy to make passive income from your assets, putting them to work in exchange for reward generation.
Ethereum transitioned from a Proof-of-Work (PoW) to a Proof-of-Stake (PoS) mechanism in an event christened “The Merge.” The transformation came as the network wanted to achieve more security, cut down on energy consumption by 99.95%, and execute new scaling solutions with a possible threshold of 100,000 transactions per second. With PoS, there are less entry barriers for miners considering the reduced energy demands.
Author

Michael Ebiekutan
FXStreet
With a deep passion for web3 technology, he's collaborated with industry-leading brands like Mara, ITAK, and FXStreet in delivering groundbreaking reports on web3's transformative potential across diverse sectors. In addition to


